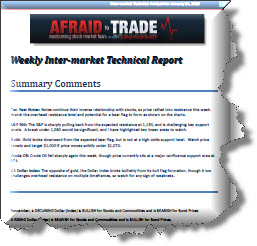
Corey Rosenbloom from Afraid to Trade.com has been charting up a storm of late and his weekly Inter-market reports have been spot on. While this is a subscription service, i asked Corey if we could put up a sample of his latest work for our readers.
So, here it is.. Click on the link HERE or the image below to access the pdf. Then, take a few moments to check out his site and insights. Good stuff!
Summary:
- Ten-Year Notes: Notes continue their inverse relationship with stocks, as price rallied into resistance this week.
- Watch the overhead resistance level and potential for a bear flag to form as shown on the charts. S&P 500:
- The S&P is sharply pulling back from the expected resistance at 1,150, and is challenging key support levels. A break under 1,080 would be significant, and I have highlighted key lower areas to watch.
- Gold: Gold broke downward from the expected bear flag, but is not at a high-odds support level. Watch price closely and target $1,000 if price moves solidly under $1,070.
- Crude Oil: Crude Oil fell sharply again this week, though price currently sits at a major confluence support area at $74.
- US Dollar Index: The opposite of gold, the Dollar Index broke bullishly from its bull flag formation, though it too challenges overhead resistance on multiple timeframes, so watch for any sign of weakness.


