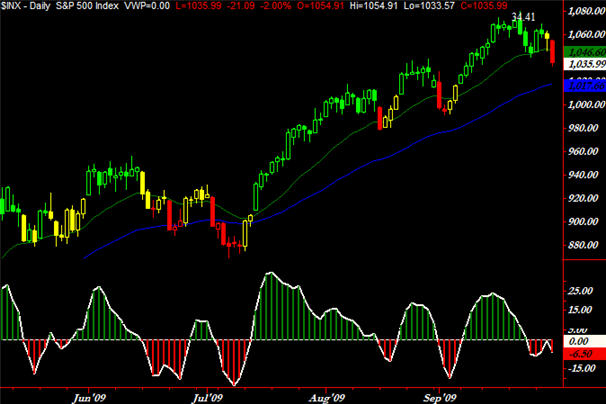
According to a chart that Corey Rosenbloom over at Afraid to Trade sent to me, we are seeing for the first time in a while the ominous RED color come out to visit us for the S&P 500. This is not an ordinary chart. It uses a few indicators inclusive of Average True Range and the Red color bar sell signal on the daily S&P 500 chart corresponds with a downside break of the 20 day exponential moving average on higher volume.
Initial short-term target is the rising 50 day EMA at 1,020, if not a test of the “round number” support at 1,000. Targets below 1,000 include the 960 price high from June and then middle of the “value area” and “round number” support at 900.
Don’t shoot the messenger…..
___
Disclosure: Horowitz & Company clients may hold positions of securities mentioned as of the date published.
__


