It has been a market that just can’t seem to accept a move down for any reason. That is just peachy, but how about the underlying moves within sectors that is now beginning to show some changes in leadership.
Whether or not equities continue higher, it is good to know which of the sectors are showing leadership and which are laggards. The potential to find stocks within those sectors that outperform may be something that can benefit a portfolio. On the other hand, weak stocks in weak sectors tend to under-perform significantly when the trend turns down.
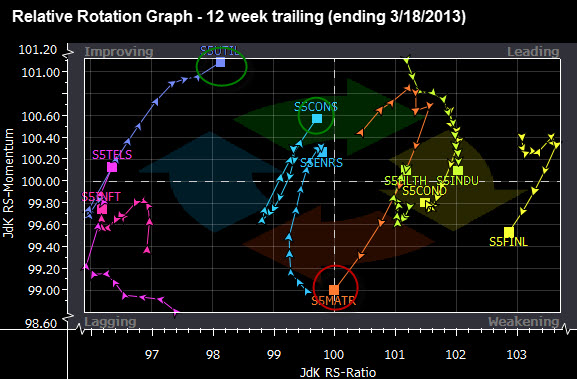
The first of the graphs shows the S&P 500 sectors over the past 12 weeks. The trails show where they were in terms of leading/lagging and improving/weakening during that time. Materials and Energy have been showing a sharp turn higher, but are still lagging on a relative basis. Utilities, Telecom and health are all showing strength.
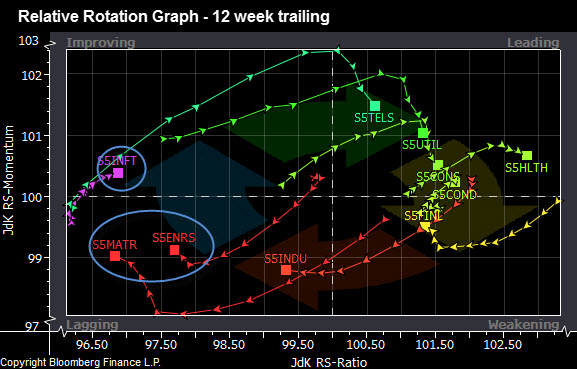
Now, lets contrast that with the previous 12-week period and you will see a much greater divergence with sectors. Utilities were literally off the chart as the hunt for yield was the play. Consumer staples were also leading. However, on a relative basis, financials were starting to show weakness.
Look back above and see how the financial sector has turned up, although moving left – oward the lagging side of the graph.