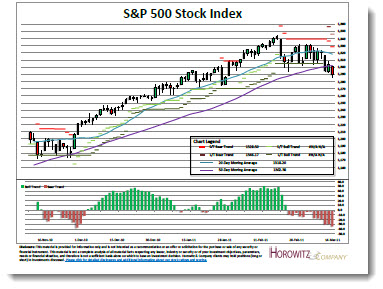
The S&P 500 looks to be finally breaking down below key support levels. Yes, this has been on the verge of occurring for some time, but now closing this far below the 50-day MA will be an awakening to the bear camp.
The chart below provides a clean look at the daily levels of importance. In particular, the character change over the past few weeks has shown up as a break below key levels of support, including the 20- and 50-day moving averages.
( Listen in to the latest TDI Podcast – HERE )
Click to enlarge. The chart provides support points as well as the next level to support a rally.


