Highlights of the 88 page report (pdf), released by the Census Bureau today. Overall, it shows a sad state of affairs for both the insurance and financial condition of our country. As more people are in need of jobs, the target is continual moving. Less employers are offering insurance and cost are climbing.
The poverty rate also climbed and there are further distinctions by age and race that show through.Something needs to be done. Any ideas?
Here are a few of the highlights of the report:
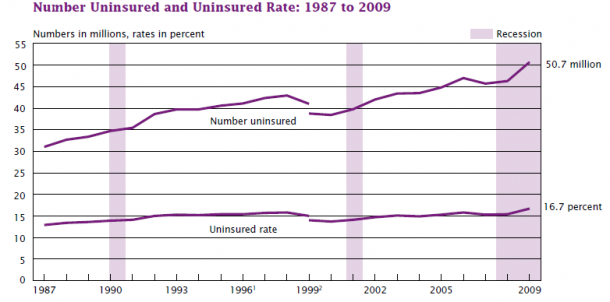
The percentage of people without health insurance increased to 16.7 percent in 2009 from 15.4 percent in 2008. The number of uninsured people increased to 50.7 million in 2009 from 46.3 million in 2008
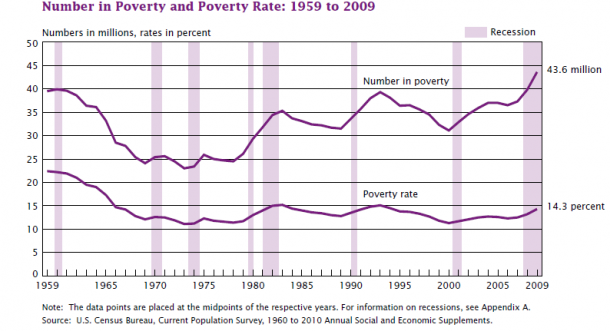
The official poverty rate in 2009 was 14.3 percent””up from 13.2 percent in 2008. This was the second statistically significant annual increase in the poverty rate since 2004.
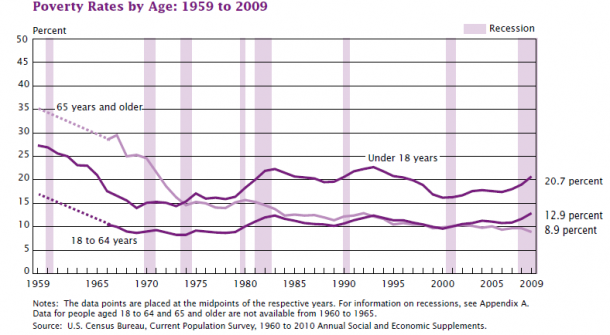
Between 2008 and 2009, both the poverty rate and the number in poverty increased for people aged 18 to 64 (from 11.7 percent and 22.1 million to 12.9 percent and 24.7 million). Both the poverty rate and the number in poverty decreased for people aged 65 and older (from 9.7 percent and 3.7 million to 8.9 percent and 3.4 million) (Table 4 and Figure 5). Both the poverty rate and the number in poverty increased for children under the age of 18 (from 19.0 percent and 14.1 million in 2008 to 20.7 percent and 15.5 million in 2009). The poverty rate for children was higher than the rates for people aged 18 to 64 and those aged 65 and older (Table 4). Children comprised 35.5 percent of people in poverty but only 24.5 percent of the total population.
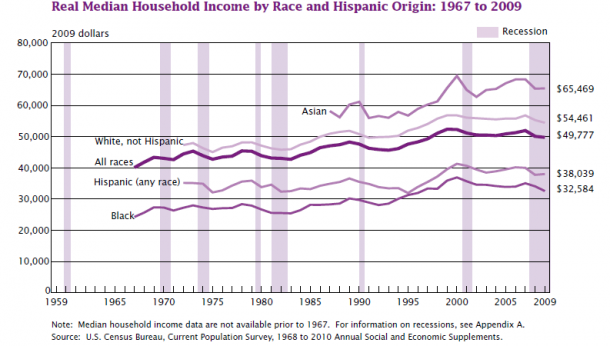
Real median income declined for Black households and non-Hispanic White households between 2008 and 2009 the changes for the Asian and Hispanic-origin households were not statistically significant. The decline for Black households was 4.4 percent, larger than the 1.6 percent decline for non-Hispanic White households. In comparison to the respective income peaks before the 2001 recession, 2009 household income was 5.0 percent lower for all races combined (from $52,388 in 1999), 4.2 percent lower for non-Hispanic Whites (from $56,843 in 1999), 11.8 percent lower for Blacks (from $36,952 in 2000), 5.7 percent lower for Asians (from $69,448 in 2000), and 7.9 percent lower for Hispanics.
households and non-Hispanic White
households between 2008 and 2009
(Table 1 and Figure 1); the changes for
the Asian and Hispanic-origin households
were not statistically significant.
The decline for Black households was
4.4 percent, larger than the 1.6 percent
decline for non-Hispanic White
households.
In comparison to the respective
income peaks before the 2001 recession,
2009 household income was 5.0
percent lower for all races combined
(from $52,388 in 1999), 4.2 percent
lower for non-Hispanic Whites (from
$56,843 in 1999), 11.8 percent lower
for Blacks (from $36,952 in 2000),
5.7 percent lower for Asians (from
$69,448 in 2000), and 7.9 percent
lower for


