The release of the intensely watched unemployment data is on the docket for tomorrow morning and tr aders especially short sellers appear to be covering positions. Tomorrow’s data has the capability to change the volatile market winds from North to South.
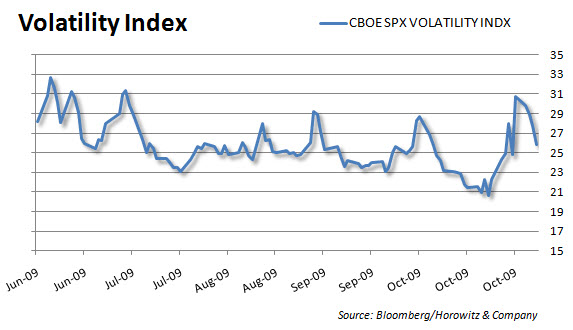
Skepticism has certainly crept into the market place with the volatility index ($VIX) more commonly known as the market’s indicator of fear reaching 4 month highs at 31.84 earlier this week (See Chart Below). Since then, we have seen volatility taper off almost as fast as it rose, even despite CIT Group’s bankruptcy filing and weak same store sales pushing many retailers such as Aeropostale (ARO), The Buckle (BKE), Hot Topic (HOTT), Kohl’s (KSS) and JC Penney (JCP) shares sharply lower.
 Since the beginning of 2009, we have seen a steady decrease in the number of jobs lost which, may signal one of two things. One, conditions are getting better and less people are being laid off or two, companies cut all the fat they possibly can and are now working with essential staff (skeleton crews) that directly correlates with productivity.
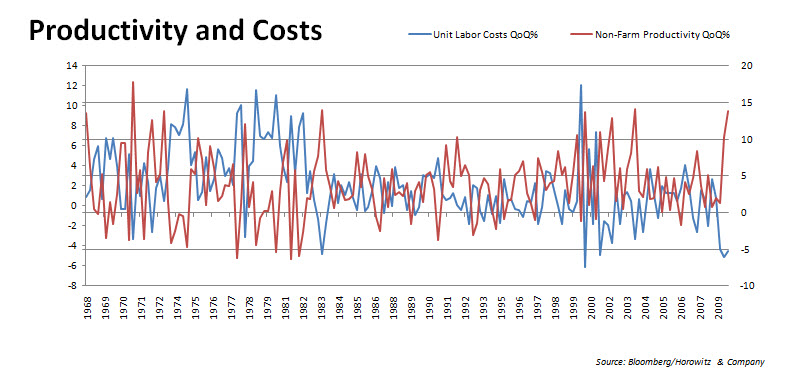
We believe the second condition is probably more likely as we are seeing an unusually large spread between unit labor costs and productivity (See Chart Below – Click to Enlarge).
Economists appear to be in consensus that the unemployment rate will move higher by one tenth of one percent to 9.9%. There are only a handful of outliers that estimate we will see a 10% or even higher 10.1% print. Current estimates put Non-Farm Payrolls at -175,000 jobs lost during the month of October with a range on the high of -105,000 (First Trust Advisors) and a low of -250,000 (ING Financial Markets) .
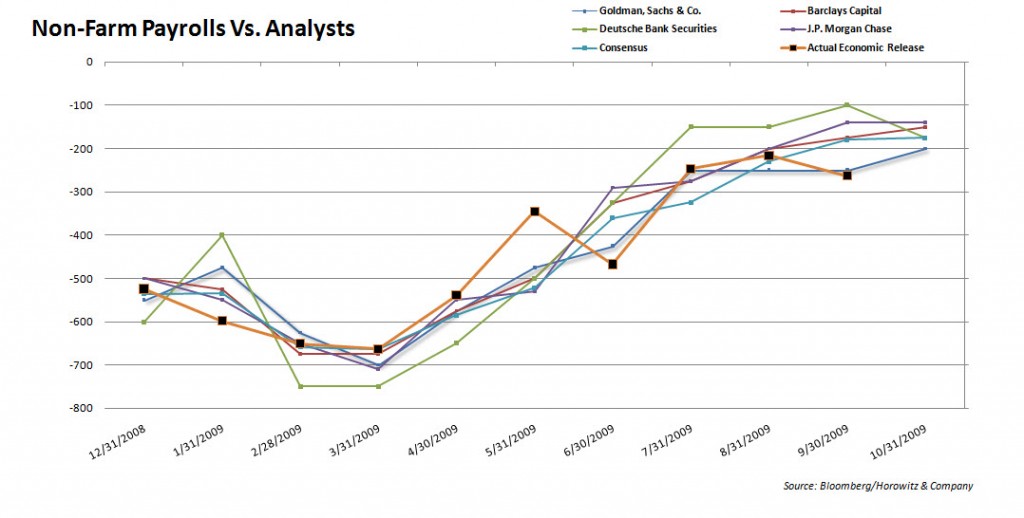
Over the past 6 months, we have seen large deviations from economists’ consensus view which has resulted in volatile market moves. On a positive note, Goldman Sachs has accurately projected the payroll numbers over the past 4 months which may have trader’s erring on the side of caution. Goldman’s economists are looking for -200,000 jobs lost vs. the consensus of -175,000. Below is a chart of the major economists historical projections against both the consensus and actual numbers.
(Click Chart to Enlarge)
Disclosure: Horowitz & Company clients may hold positions of securities mentioned as of the date published.


