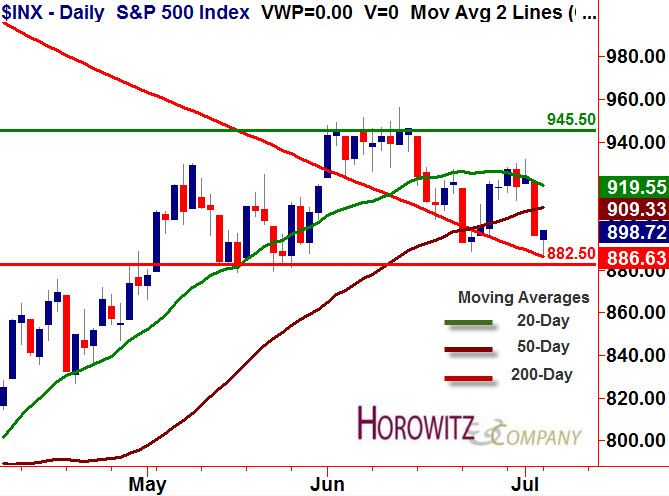
After a long Independence Day weekend for U.S. equities it appeared stocks were set for a decline. Everything played out as expected even after strong ISM Services data was reported at 10:00 A.M. Minutes after the data was reported stocks edged slightly higher and the DOW even peeked into positive territory before retreating to new lows on the day. Key levels of support came into play at 10:45 A.M. after stocks were poised to continue lower.
The 200 day moving average provided the catalyst for the S&P 500’s mid morning strength. In the chart below you will see that the S&P 500 rebounded exactly at the point of the moving average. With this level of support established, trader’s remained confident entering into long positions which caused a trend day higher from 10:45 A.M. on.
Tomorrow, we will be looking for some short term resistance between 900 and 905 in the S&P 500 and if we are to break those levels there could be a push to move back to 920. This may be the more likely scenario tomorrow coming off the heels from Monday’s mid morning strength from the ISM Services data and establishing support at the 200 day. However risk still remains to the downside and a possible re-test of the 200 day moving average. If we are to test the 200 day moving average and move lower the next level of support would be between 875-880. Any significant break of this level could signal significant downside potential across the board.


