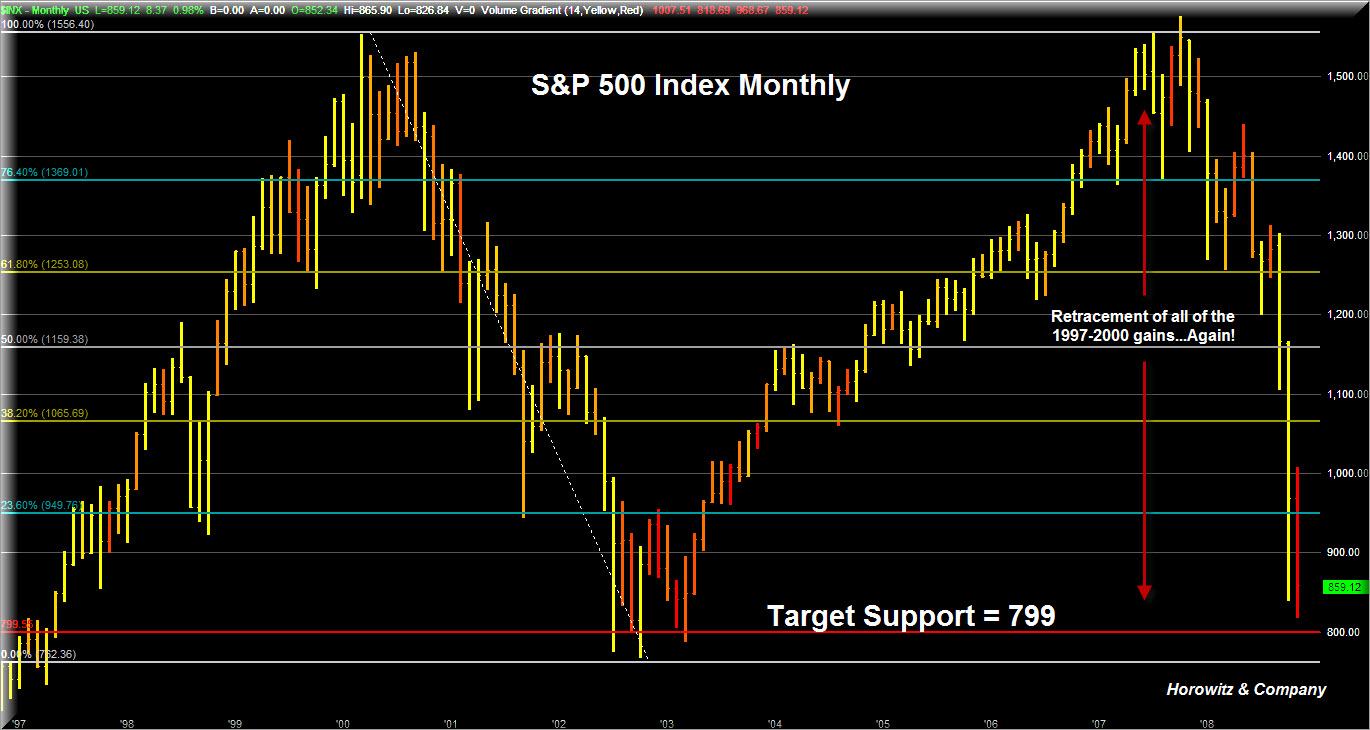
Today we hit an interesting level for the S&P 500. Intraday, we moved down to decade old support levels and then as if on queue, buyers (aka the Plunge Protection Team) came in to move the markets back up, turning a significant loss into a reasonable gain.
While that appeared to be good news, there was much more that needs to be looked into as there are neon signs flashing warning. By all measures, the next support level for the S&P 500 is very important.
Click on the chart below and enlarge to see a monthly history of the S&P going back to 1997. We have now taken back most of the massive gains that were booked during the 1998-2000 bull market…for the second time ! Surely investors are going to be very nervous and arguably looking for any excuse to bail.
The next level of support appears to be 799 for the S&P 500 which is the double bottom of 1997 and 2003. This is reason enough on its own to keep a neutral/short portfolio allocation. Add to that a confused Congress, a bailout happy Treasury Secretary and a lame duck President and it makes for a lethal recipe. Don‘t even bring up fundamentals as this will tip us right over the cliff.
The high level of the VIX (60+) also provides additional data to believe that another retest (or more) is possible as the range of returns could easily move the index through lower support.
How long will buyers keep on believing that a bounce from the lows is automatic?
Thoughts and comments please…..


