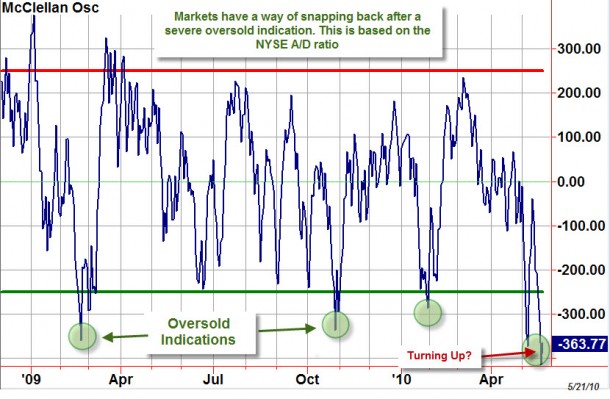
Earlier this week, we had Tom McClellan on the TDI Podcast and we discussed a few of his timing models and what they were predicting. One that we like to watch to get a good idea of the sentiment within the markets and to consider potential oversold and overbought conditions ( along with several other indicators) is the McClellan Oscillator.
Often times, it will show a super-oversold and signal that it could be an interesting time to consider a long entry once the trend turns.
In fact, in today’s report (Get a free trial HERE) this is what he said:
In case you are wondering, the answer is yes, this is a new record all-time low for the NYSE‘s McClellan A-D Oscillator. That is, it is a record for the raw McClellan Oscillator. If we use the Ratio-Adjusted McClellan Oscillator (RAMO), which adjusts for the changing number of issues traded, then that number is -136. That is pretty close to the -141 that we saw in the crash of 1987, but it is a long way from the all time record low RAMO reading of -176.2 seen on Oct. 10, 1932.
Still, as we see in the first chart, any reading below -300 is a pretty rare event, and is associated with an important bottom for stock prices. But even if this is the lowest Oscillator we are going to see for this selloff, that does not necessarily mean that the final price bottom is in. It is close, and it may be in, but we don‘t get any guarantees about that…
As we see it, the Oscillator hit under -400 this morning and is quickly turned higher off of the open. If we see a break above -250 on the way to breach the zero line over the next week, we may have actually just seen the bottom. Of course the exogenous events of late within Euroland needs to calm down and reach a consolidated resolution before any market will show a reduction in volatility and risk appetite re-appears.


