

On DHUnplugged this week, I suggested that Gold was looking that it was ready for a breakdown. The basic thesis was that most of the rise in gold was priced in ahead of the Fed’s decision on Wednesday. In fact, it looked as though the support levels for gold could break and sharp move lower would ensue if that were to occur.
On the news that the Fed had done something (still unclear about what is the extent of the stimulus/liquidity addition) gold moved sharply higher, until the end of Mr. Bernake’s comments. Then the realization that he had not provided much clarity or any real additional stimulus was recognized and gold started to trend lower.
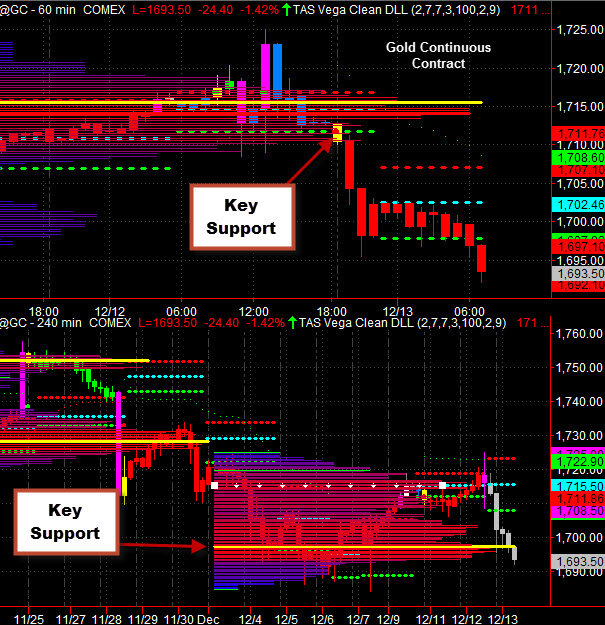
Below are the 60 minute and 240 minute charts (Tradestation) that have the indicators that we are using to track the key levels of support and resistance.
Note that the yellow horizontal lines are important points on what we call the Market Map. Once these levels are breached, there is a clear view that there was limited support and the price quickly moved down to the next target of $1692. That price was confirmed on the 240 minute as well.
These indicators (TAS PROFESSIONAL) are some of the tools that are also used on TPR ALERTS! in order to generate trading signals.
(Note: Horowitz & Company clients are short gold as of mid-day Wednesday)
So, where to now? If the price can reach 1698, we would suspect that resistance may hold. If it does, then the target is back to 1692. If price can breach 1700, then the upside target would be 1715. For now, the better side of the trade is short on all bounced into resistance.


