We are watching corn pricing closely as it has a direct effect on the profitability of many companies. It also will be important when considering the cost of gasoline at the pumps.
In particular, we are interested as we are long a few of the poultry distributors as mentioned HERE and short Buffalo Wild Wings.
The crop report (view report) was bullish for corn today, but not as bullish as some expected. Initially corn futures popped on the release at 8:30am, but has since come down 4% from that level.
Earlier this morning, we posted a video of the levels to watch from TAS Professional.
Here are a few more charts to consider.
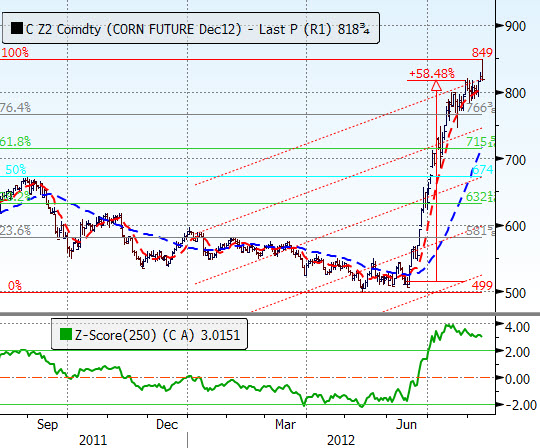
Above are the Fibonacci retracement levels from the low in May until the peak this morning. Take a look at the Z-Score and how it has peaked well above
The Z-Score measures the distance in units of standard deviations that a chosen data line (e.g. Open, High, Low, Close) is from the moving average of this line. For example, if a Moving Average of period 20 is applied to the Close, a Z-Score value of 2.37 indicates that the close is 2.37 standard deviations away from the moving average at that point.
This indicator is based on the same theory as Bollinger Bands, but generates an alternative measurement that can then be interpreted and used to make determinations about market action.
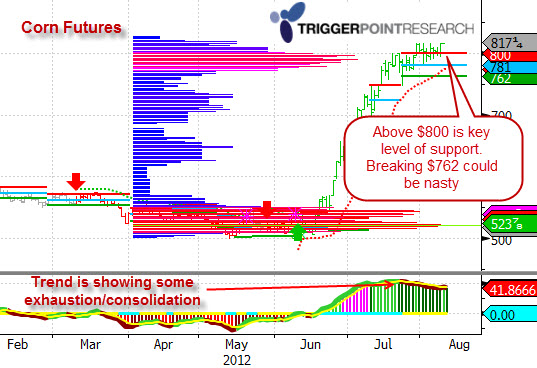
Below is the chart that shows a much better view of the market profile and key support and resistance. Note that the bottom of the chart shows additional details about the trend pattern/strength.