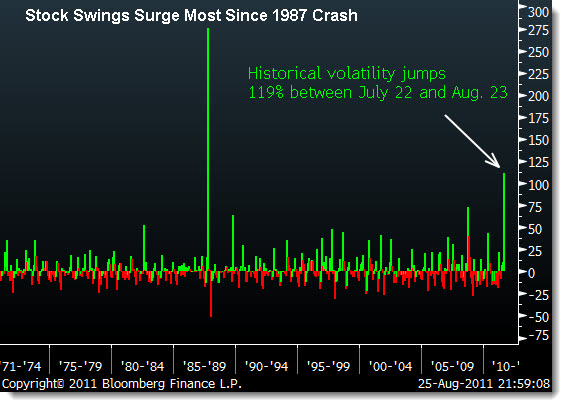
Bloomberg Pro often has great charts that tell a story in a simple frame. We know that the recent swings in markets are unusual, but just how unusual are we talking about?
Thinking back to 2008/2009, there were 700 point days – that seemed pretty wild. But the fact is that the last few week’s action actually tops that from a volatility standpoint.
From Bloomberg:
By Cecile Vannucci and Jeff Kearns
Aug. 25 (Bloomberg) — U.S. stock price swings are widening at the fastest rate since the 1987 crash as concern the economy is stalling and optimism the Federal Reserve will try to spur growth whipsaw investors.The CHART OF THE DAY shows a measure known as three-month historical volatility for the Standard & Poor‘s 500 Index jumped 119 percent between July 22 and Aug. 23, the biggest rise over the same amount of time in almost 24 years, according to data compiled by Bloomberg. Excluding that year, the current increase is the biggest in at least four decades.
“We‘re going to remember these times for the rest of our lives,” Brenna Hardman, a derivatives broker at MEB Options LLC, said in a phone interview yesterday from the Chicago Board Options Exchange. “People are scared. And I‘d say bars around here are seeing their bottom lines increase. I‘ve never spent such long days on the floor, and you don‘t see anyone walking down here smiling very big.”
The Dow Jones Industrial Average rallied or declined 400 points on four straight days this month, the longest streak ever, as S&P‘s reduction of the U.S. government‘s credit rating fueled concern the economy will falter. Harvard University economics professor Martin Feldstein, a member of the National Bureau of Economic Research that measures recessions, said this month that the odds of a contraction are 50 percent…
___
Looking to invest in The Disciplined Investor Managed Growth Strategy?
Click HERE for the virtual tour….
___


