Just to state what we see – it looks as if the massive sell-off that occurred yesterday, “felt” like it is close to a capitulation bottom. That said, what any of us “feels” is unimportant. The market direction and volume is the best indicator and history has often shown that reactions by investors are often overstated.
So, it goes without saying that here has been a severe reaction to the most recent economic data out of the U.S. and other countries. Some are calling this a “soft-patch” and others are seeing a more pronounced slowdown coming. Most of the real worry began once the revisions to the U.S. GDP was announced. It just goes to show that sometimes there is a payback for overly optimistic statistical reports.
Over the past couple of years, it is very apparent that the number of revisions to the downside has become part of the background that is expected to occur. Some even believe that there is a plan at work to provide better numbers in the initial reports in order to instill confidence. The idea is that these better numbers will help create an more optimistic investment and consumer environment that perpetuates a positive feedback loop. From there, the basic concept is that negative revisions should be discounted as they are past occurrences.
___
Looking to invest in The Disciplined Investor Managed Growth Strategy? Click HERE for the virtual tour….
___
Who knows if this is really occurring with economic reports. (Note: The FED has clearly used this tactic as they routinely hold back information that they believe will have a negative impact on markets. Look back to the recently released banking information that was delayed for two years in order to “protect” markets.)
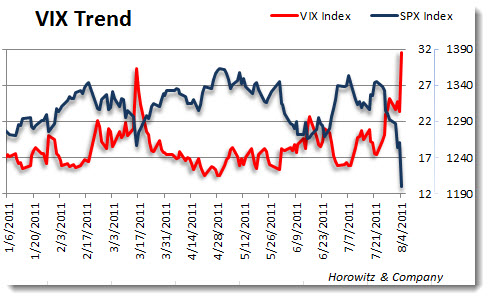
All that being said, there has been a very pronounced spike in fear within the global equity markets that has investors running for the exits. The spike in the VIX is consistent with what has been occurring in the markets…Finally.
Perhaps there has been a dose of reality infused in this sell-off that has not been seen over the past several months. Complacency has been a big part of the recent market environment and this wake-up call may have been just what is needed to shake-out the weak holders.
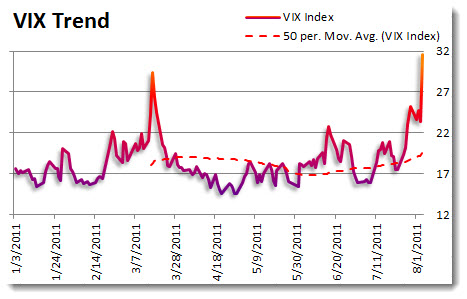
Back in March, there was a spike in the VIX that lasted only a few days as traders were conditioned to sell volatility at ever juncture. Of course it “feels” really bad every time the market drops, but the real question is whether the reaction has been justified. (Of course this is with respect to the fact that markets ARE always right – at any point of time)
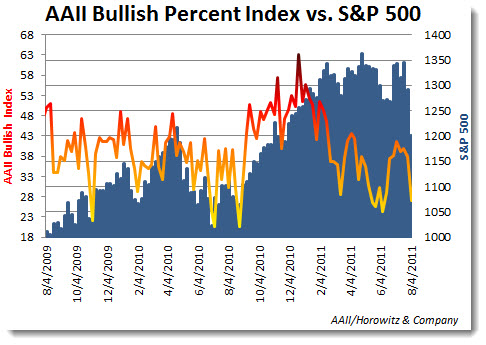
Bullishness has been dropping according the the AAII index and that is also a good contrarian indicator. Often times, this gives a reversal alert, just when things are at their worst – or best. The chart below illustrates that well.
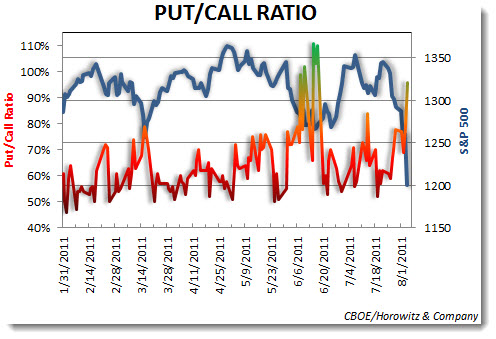
The Put/Call ratio also shows the same situation as above. Pessimism is creeping in and that is exactly what bulls want to see. The more negativity, the more opportunity to get a short-covering rally as bears cover reverse their short positions. As the markets have been selling off with increasing momentum, investors have been adding to their put option exposure providing some additional negativity that is available to be reversed. Short-covering rallies are usually the start of any rally in markets – no matter how long that uptrend lasts.
Perhaps more compelling is the -311 reading on the McClellan Oscillator. This is a measure of the overall advancing issues to the declining for the NYSE. It is rare to see a reading lower that is below -250.Often times, reading above or below 250/-250 are meaningful times that can be considered overbought or oversold. Of course, markets will often overshoot in one direction or the other and this indicator gives a nice view of that action.
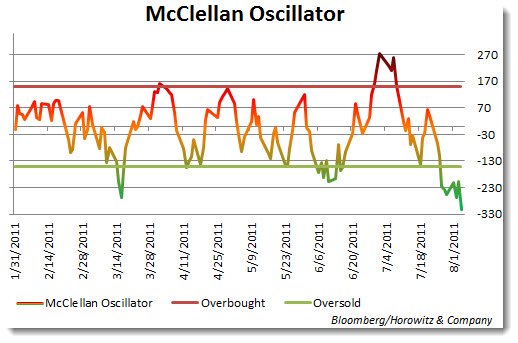
This is exactly what Tom McClellan wrote about last night:
“The big negative breadth on Thursday took the McClellan Oscillator down even lower. It had already been down below -200 for 6 trading days, and Thursday‘s selloff took it down below -300. That is a seriously negative number…” “… as far as the ugliness of late 2008, and you can see that the Oscillator only gets down below -300 a hand-ful of times. Perhaps more importantly, none of the Oscillator lows below -300 marked the final low for the down move.”
“…for the moment, the -318 100 Oscillator reading is a sign that the rubber band is really -100 stretched. We saw the Oscillator
get down below -300 twice in May 2010. The first one was during the May 6-7 Flash Crash, and the result was a rebound of over 500 Dow points in just 3 days, before the market rolled over and put in a lower Oscillator low at -426 (which is the all-time low)…”
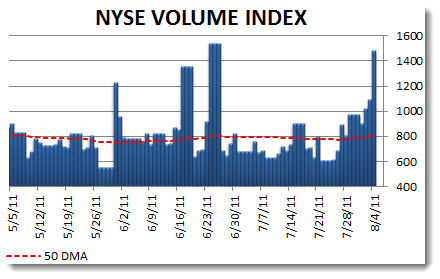
NYSE volume spiked yesterday as investors woke up to the equity bloodbath that was occurring around the world. Again, this is a sign that the complacency has been interrupted for the moment and panic has now set in. It appeared that babies were being thrown out with the bathwater as 98% of the S&P 500 stocks were down.
Again, every trend reverses at some time. The question is whether the trend is finished or simply interrupted. Right now, we are still in a longer-term rally mode with this being a warning. The jury is still out.
The bottom line: Markets are due for a bounce. Today will probably be a mix of short-covering action as the better than expected jobs report surprised most. There will be a great deal of skepticism that will hold back investors until volatility drops. Assuming that occurs, the uptrend will resume, until then, caution is the rule to be observed.
—
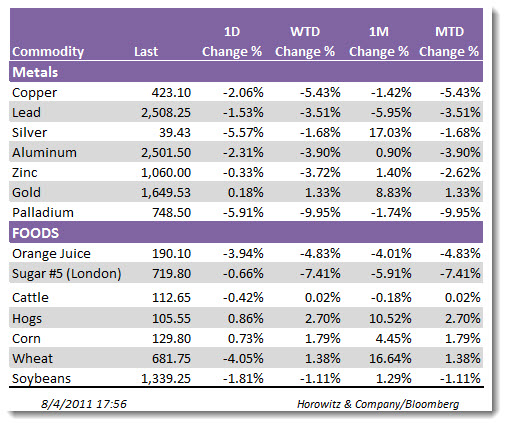
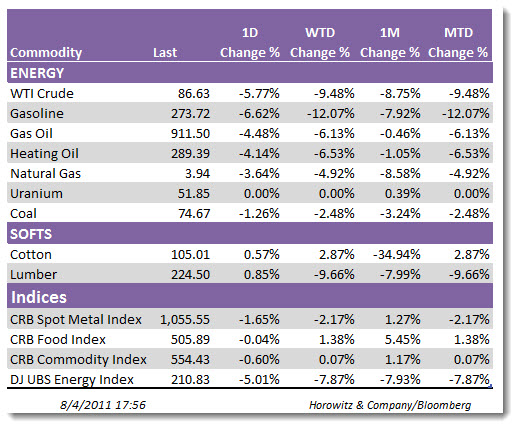
Just a couple of quick charts of the recent rout in commodities that shows how badly things are. The good news is that oil and gasoline prices are dropping for consumers. Below the $90 level for crude will be good for markets as the overhang of constrained consumption will be relieved – at least for as long as that lasts.
