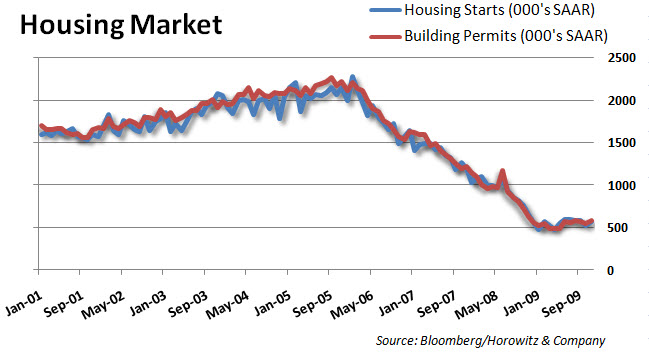
If we look at the housing starts over a short period of time, we can see how numbers are looking better; of course from a LOW base. That is the perceived as good news as shown in headlines and in commentary from the bullish camp.
Housing stocks such as DR Horton (DHI) and KB Homes (KBH) are doing well on the news as there is big hope that buyers are coming back into the market. There is definitely something to say about giving a big-fat tax credit to inspire people to buy a new home.
But lets get back to our senses for a moment and realize that this is far from a confirmation that the housing problem is over. It is also in no way a clear signal to get anywhere near the sector as the fundamentals and the overall outlook for these companies are still raising caution flags.
If you are looking for a trade, sure, but no way are these ripe for a Disciplined Investor.
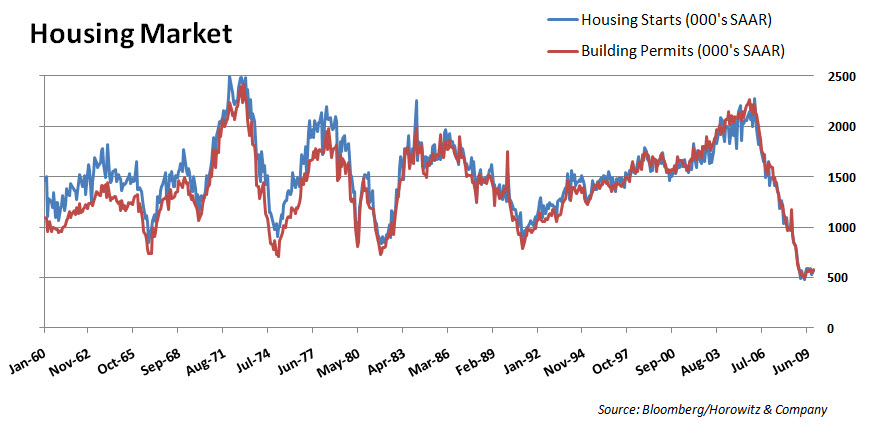
Looking at a longer trend we can see that there is still a long way to go for housing starts to come back to their previous high. Right now it would be nice to see a bounce UP to the low point we saw in the 1970s. Back then, it took about 3 years for sales to come back after the housing meltdown.
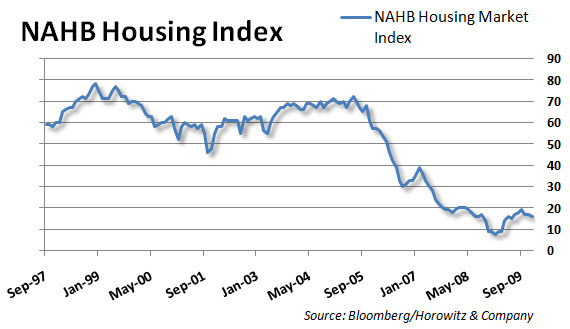
On the other hand, the NAHB survey released yesterday provided a much different picture of what is happening in the single family market. Now well below 20, the index weakened last month showing us that there is still a good amount of slack and a general lack of buying pressure emerging.
Our thoughts are that this is a leading indicator and though there was/is a rush to get the tax credit and lock-in before rates move higher, new home sales will NOT move in a linear fashion.
From the NAHB:
Housing Market Index (HMI) is based on a monthly survey of NAHB members designed to take the pulse of the single-family housing market. The survey asks respondents to rate market conditions for the sale of new homes at the present time and in the next 6 months as well as the traffic of prospective buyers of new homes.
The HMI is a weighted average of separate diffusion indices for these three key single-family series. The first two series are rated on a scale of Good, Fair and Poor and the last is rated on a scale of High/Very High, Average, and Low/Very Low. A diffusion index is calculated for each series by applying the formula “(Good-Poor+100)/2” to the present and future sales series and “(High/Very High Low/Very Low + 100)/2” to the traffic series. Each resulting index is then seasonally adjusted and weighted to produce the HMI.
Based on this calculation, the HMI can range between 0 and 100.
___
Disclosure: Horowitz & Company clients may hold positions of securities mentioned as of the date published.


