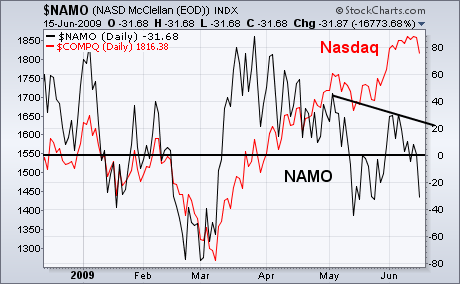
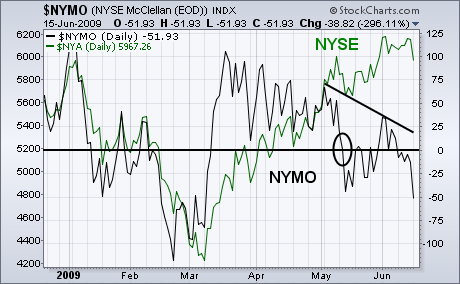
The McClellan Oscillator has been a good tool that has been rather accurate in showing directional trends resulting in turning points for markets/indicies.
Below are the most recent charts that show the indicator on the NYSE and the NASDAQ. Both are turning and have breached the “zero line,” showing that a directional change and trend is upon us. Usually, tops and bottoms are seen when the indicator reaches +/- 80 and then turns in the opposite direction with a steep incline.
—


