

Gold ETF (GLD) – Time to Make or Break…
This is an update on the potential for a intermediate-term change of trend for Gold ($GLD), based on our TriggerCharts technical indicators.
As we are all keenly aware of. there has been some noticeable momentum in gold recently , even as the U.S. dollar remains strong. Knowing when to enter a position in the commodity future, Gold ETF (GLD) or even the Gold Miners (GDX) will be an important consideration. From the chart perspective, Gold has generally been in a downtrend for months, which accelerated in November.
The chart below highlights the importance of knowing where the key levels of interest are in order to initiate and exit a trade. The red, blue and green horizontal lines drawn on the chart are based on our Altimeter (standalone or part of the TriggerCharts Commander Series) indicator. This is an algorithm that specializes in using volume-at-price, based on Market Profile theory. In other words it shows support and resistance that can be used as a trading guide.
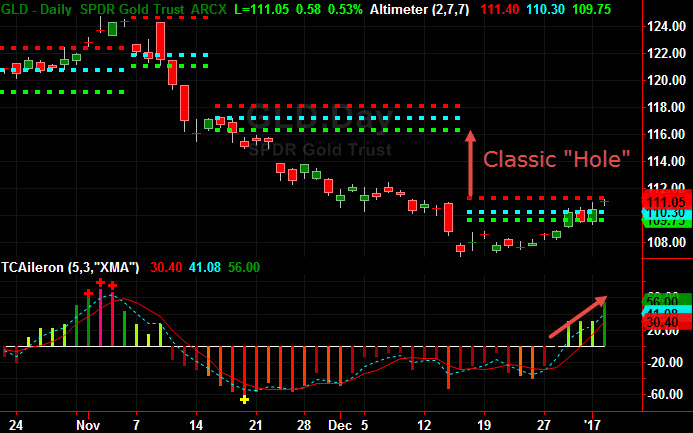
Notice that the price is moving up into the “red” resistance level. Above that there is a classic “hole” where there has not been a great deal of buying or selling interest. That creates the potential for a swift move, if the price breaks above resistance.Another confirmation of the potential change in the trend is the move on the Aileron Indicator (lower part of chart). This momentum-based calculation is showing that there is a upward momentum that is now building.
So, we know that momentum is building and that a break above the red resistance level ($111.40) moves the price to a “hole” that can provide a swift move to the $116 level – the initial profit target.
From there we can set an alert to look to enter a long position above the resistance area and use a level below the main support (blue horizontal line) as a stop.
Yes, it can be that easy with our indicators – available for the TradeStation Platform. Find out more at TriggerCharts.com
NEW – TriggerCharts EcoTrack can be downloaded directly to your platform from the Tradestation Trading App Store.
If you want to see additional TriggerCharts indicators in action, you can check out the free video library for all of the .
Take a 10-day FREE trial of any TriggerCharts premium products to see how they work!
Free Trials and More…
Aileron360 adds TradeStation’s scanning capability to quickly filter hundreds of stocks, ETFs, futures and currency contracts to create trading ideas on dozens of different key conditions. From there, the RadarScreen can be used as a watchlist that will alert when conditions are prime for an entry into, or an exit out of a position.Altimeter, Auto-Pilot and Radar can be used as either a standalone indicator or part of the TriggerCharts Commander Series for TradeStation.
You may download a free trial of any of the TriggerCharts indicators – by clicking the link below:
CLICK HERE FOR TRIGGERCHARTS FREE TRIALS
There are also many tutorials and videos available on the TriggerCharts.com website.


