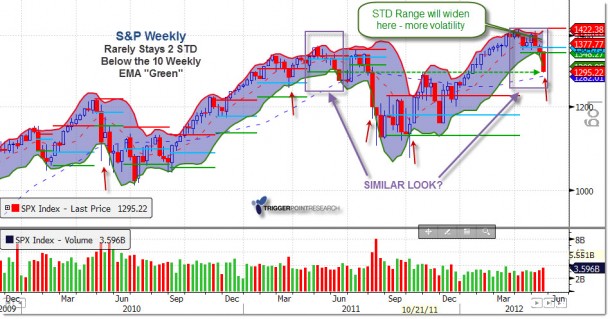
We will see how the week plays. But we did some work to see if there is any support for a bounce from what appears to be a fear driven sell-off. Take a look at the weekly chart below. The 40-week is support, down a little from here. This is the similar look as last year at this time, with greater velocity. But, note that 2 standard deviations from the 10-day exponential moving average is not often seen – Just a thought…
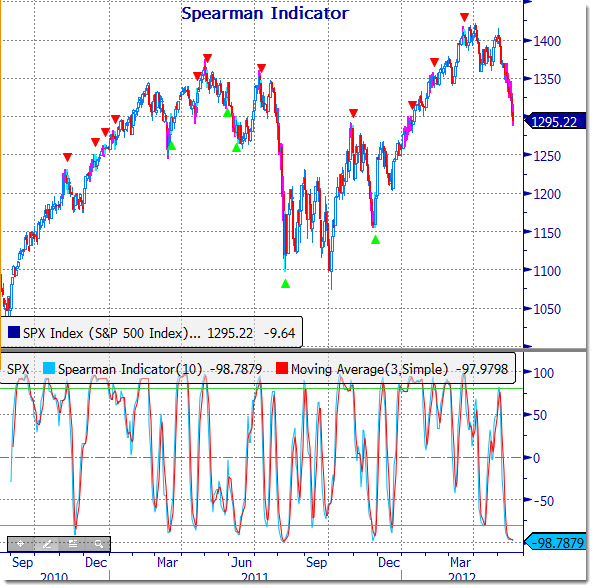
Now, the Spearman is saying the same thing. OVERSOLD. In fact, when the bounce occurs, it looks like it will be dandy. It may be short-term, but could be wickedly violent.
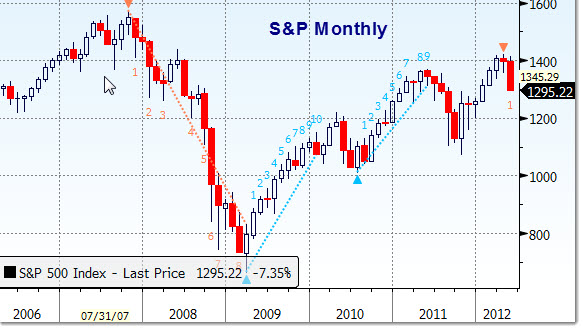
Monthly Candle Session- via Bloomberg Pro. We first brought this out on May 14th (Click here for more information)
What this is telling us is that the trend down has taken hold and the count looks like the longer term is showing that there could be some very ugly potential for markets over the next few months. However, the fact is that there still may be times where stocks become buy-able for short-term trades with specific stops in place.
Summing it all up shows that there is a overly negative position and sentiment is LOW. Here are a few more indications that we are getting into a zone that is often telling of a quick turn.
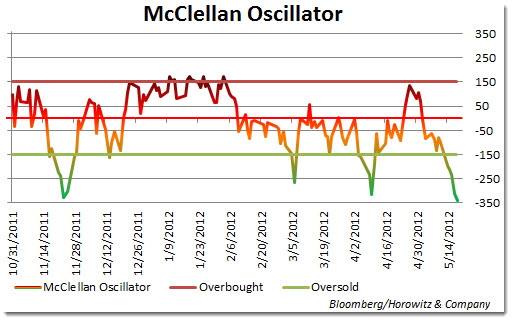
The McClellan Oscillator is at the lowest point since August 2011. That was a turning point.
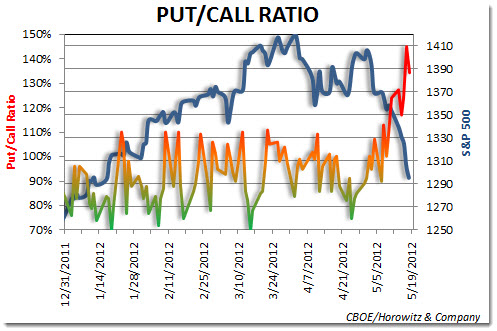
Then the Put/Call ratio is well overdone, signifying great levels of bets on the fall of markets. Often times when it gets well above 100 there is a rush to cover when there is a hint of good news.
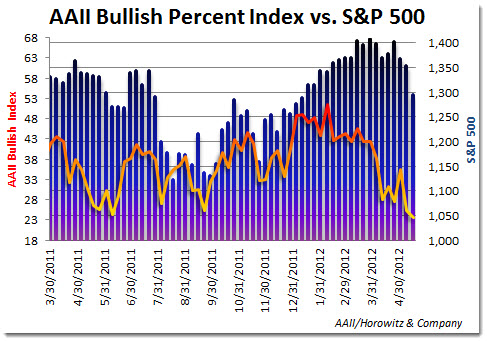
Finally, the AAII Bullish percent is a contrary indicator and the bullishness is absent from investors.
Just reading the tea leaves here. Thoughts?
We will post the support and resistance levels if a bounce occurs – stay tuned…
________
Live and Alerting
(Click the above for more information)


