There are many different chart patterns that can be used to provide a broad overview of market activity and projections. Head and Shoulders, Doji’s, Shooting Stars and Flags and Pennants, to name a few. Some are more reliable than others and that is an important consideration when using any of these as tools to project the future.
Moreover, predicting anything in an environment that has governments sticking their paws into every aspect of the financial system (bonds, currencies and stocks) can be hazardous to a portfolio. That said, there is a rather clear pattern of a Bear Flag (continuation pattern) that is now been confirmed by a breakdown of the lower channel.
A Bear Flag is a sharp, strong volume decline in price with several days of sideways to higher price movement. The consolidation needs to occur on weaker volume than the decline. It is also called a continuation pattern as it is followed by a second, sharp decline to new lows on significant volume.
The technical target for a bear flag pattern can be calculated by subtracting the height of the flag’s pole from the breakdown of support of the lower boundary of the lower trendline, drawn through the lows of the consolidation. Some technical analysts will use the swing high level for the high measurement to calculate the target downside for the pattern.
(Two good sources for additional information on this pattern are StockCharts and AfraidtoTrade )
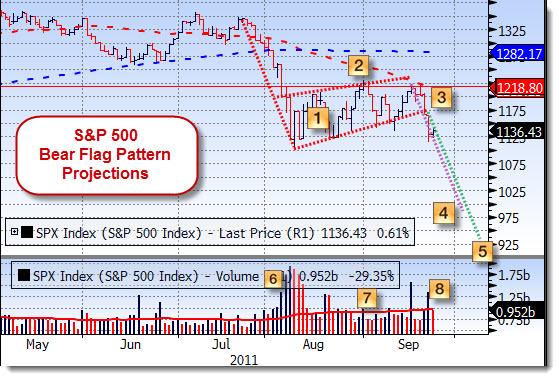
Below is the S&P 500 Index with the Bear Flag pattern that has just been confirmed. Note that not all patterns will complete and failures are bound to occur. This is simply a guide to the potential that can be used for idea generation and portfolio protection.
In the case of the S&P 500 we have the height of the flag pole at approximately 345 as the pole extends from 1,345 down to 1,100. We see the breakdown point of the consolidation at 1,175 and have had two days of higher volume with a follow through day. According to how we read this technical study, the short-term target for the S&P 500 is at around 986 (or 935, depending on the level of measurement). That equates to an additional downside risk of .
Looking at the chart, here are the numbered points of interest:
- Flag Consolidation (upward sloping)
- Swing high of consolidation
- Breakdown point, under low trendline of flag consolidation
- Target 1 if measured by swing high (#2 above)
- Target 2 if measured by breakdown (#3 above)
- Higher volume during pole formation
- Lower volume in during flag consolidation
- High volume breakdown
At this time, it seems prudent to stay out of the way of the markets as volatility is high (VIX > ~40), volume is heavy and liquidity rules. A break back above 1,250 would signal a reversal/failure of the trend, but for now as one Goldman Analysts said late last week: “Let’s Cross our Fingers and Hope”.
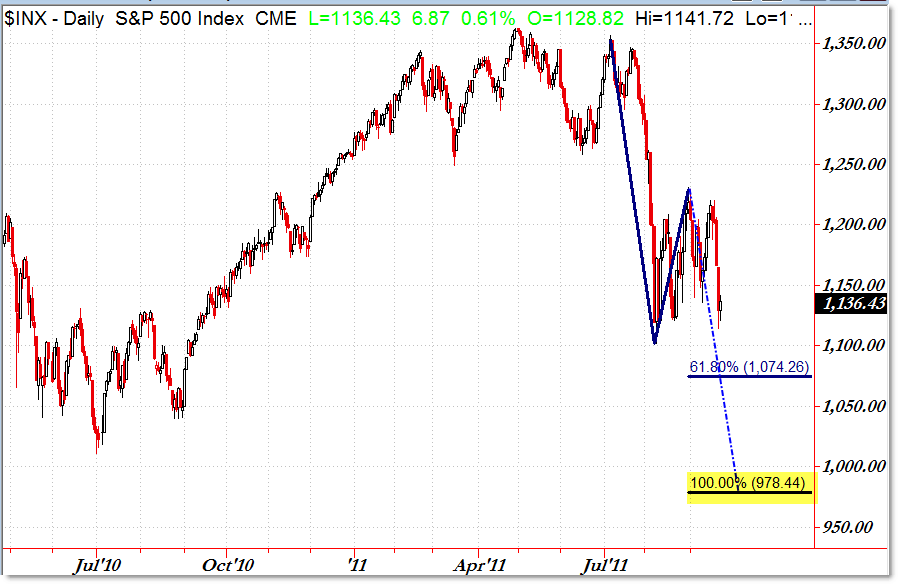
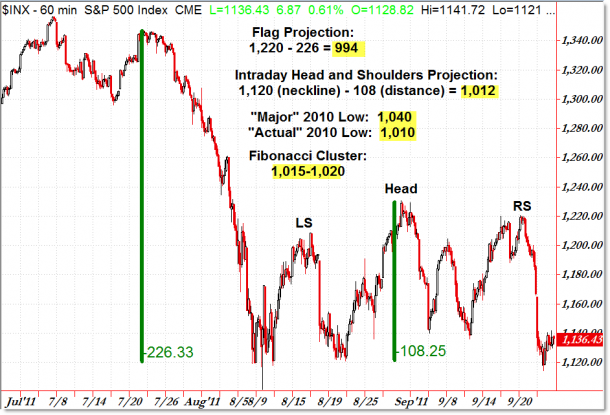
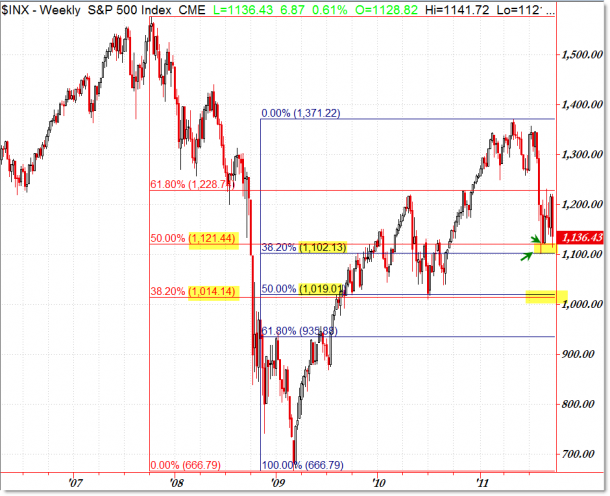
Some additional charts with targets from Corey Rosenbloom at AfraidtoTrade.com.


