Our good friend Corey Rosenbloom, a master at technical analysis, has provided us with an update on the Elliott Wave for the S&P 500 Index. Some of the information may be new to you, so make sure to visit Afraid to Trade.com to get further education on the subject.
With a major inflection point possible here in the US Equity Indexes, let’s take a quick updated look at the current large-scale Elliott Wave Count in the S&P 500.
First, we must understand that the Elliott Wave method is one of many methods to analyze the markets, and it is only one input into the diverse strategies and indicators we can use. This post will focus only on the Elliott Wave count of the past and present.
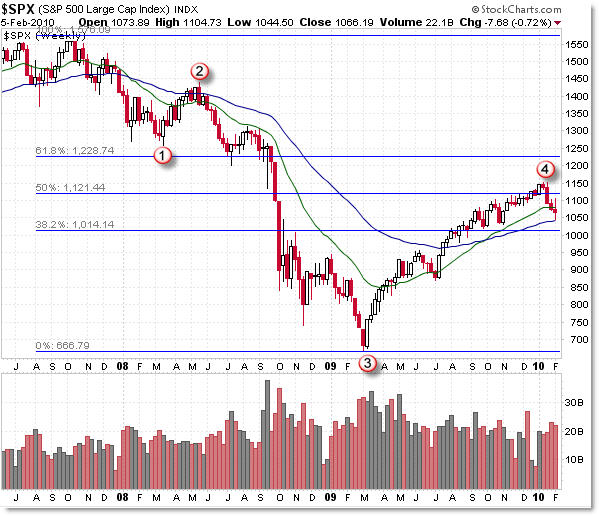
The first chart shows the the simple S&P 500 structure with a standard Fibonacci Retracement grid:
Starting with the October 2007 high of 1,576, we begin the count at wave 1 while Wave 2 is the retracement higher into the March 2009 high. True to the theory, the third wave was the most powerful, beginning in May 2008 at 1,450 and ending at the March 2009 lows of 667.
Using that as a departure point, we would then consider the sharp rally from the March lows to the January 2010 highs as a powerful 4th wave that corrected a portion of the prior decline, ending at 1,150 which slightly overshot the 50% retracement at 1,121. If indeed 1,150 holds as a top, then we would have increased confidence if not confirmation in this count. The count you see above would be invalidated with any move above 1,200 (specifically 1,250, as the principle states that “Wave 4 cannot enter the price territory of Wave 1”).
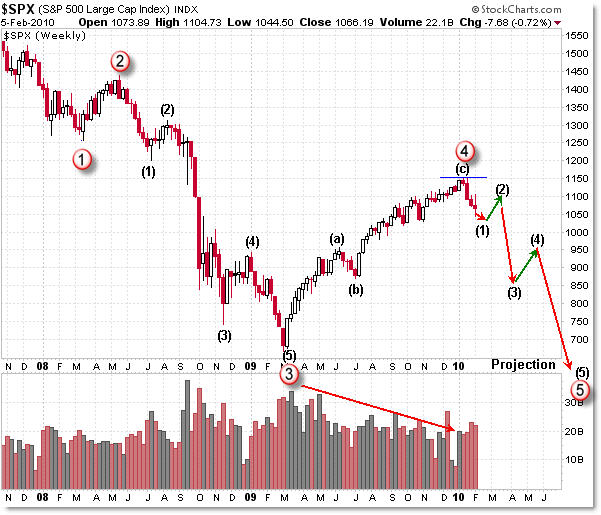
The three-wave corrective structure complete with the lengthy negative volume divergence (meaning price continued to rally while volume declined during the rally, serving as a non-confirmation) increases the odds that we should interpret the rally – as powerful as it was – as a corrective phase rather than an impulsive one. Generally, bull markets are seen to have increasing volume during the rally, not declining volume.
Now, let’s take a specific look at the wave count and a possible structural projection going forward if indeed this is the dominant count:

This chart isn’t meant to scare you, but is meant to take the logic of the potential count to the final degree, meaning if indeed we are truly seeing a Wave 4 corrective wave end, then we would expect a return to the final impulsive wave which would be expected to unfold in five smaller (called “fractal”) waves. This is not meant to be a precise projection of timing or price, rather to underscore the expectation – according to Elliott Wave Theory – that a five-wave impulsive move would be the expected ‘pathway for price’ into the future.
Remember, Elliott Wave is only one way to interpret the market and is never intended to be the only way to interpret the market.
This bearish view would be significantly called into question with a break back to new recovery highs above 1,150 and officially invalidated with a break above 1,250.
Until either of these two events happen, this would be considered the “consensus” view using the Elliott Wave principle as a guideline.
Unfortunately, this viewpoint calls for a retest over the next few months or into 2011 of the March 2009 low of 667, and a final termination target slightly lower than that, but that is too far into the future to project accurately here.
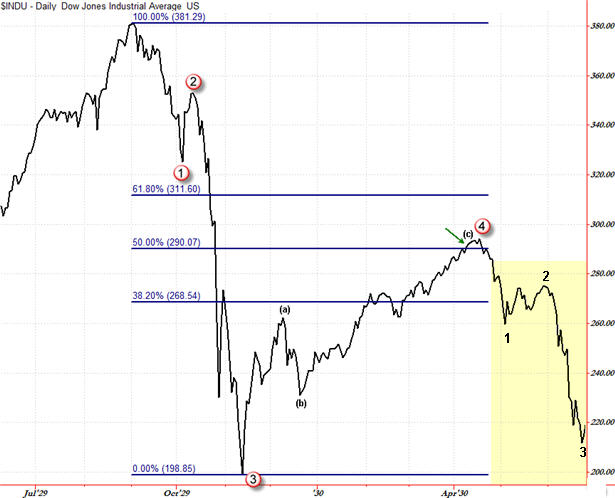
As a matter of comparison, I wanted to show a similar pattern which looks eerily similar to the chart structure of today.
It’s the Dow Jones Index snapshot of the “Crash” of 1929 and then the recovery that slightly exceeded the 50% retracement just like today:
Not only is the initial decline similar to what we’re seeing now, but the rally was very similar to what we are seeing now in early February.
Unfortunately, price fell much lower than the 200 index level that comprised the Wave 3 bottom. Let’s hope we don’t get a repeat performance on the way down should price continue falling.
I show this chart as an observation of “Hmm, that’s interesting” instead of saying “This is what will happen” because markets are different than they were 70 years ago, but it is interesting nonetheless to compare similar structures like this.
Continue watching the price to see how closely we follow the projected pathway, or – hopefully for investors – sidestep the warnings of lower prices ahead that the Elliott Wave theory is forecasting.
Corey Rosenbloom, CMT
Afraid to Trade.com


