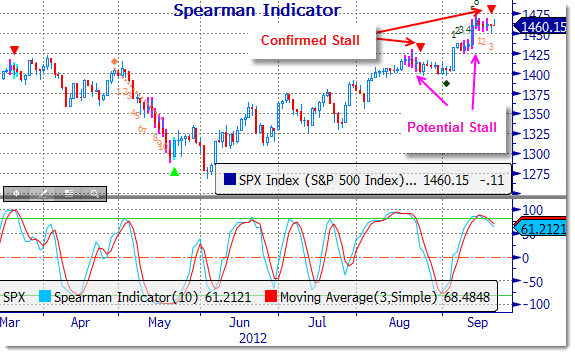
This is a chart that we have presented many times. It is simply the S&P 500 index and a couple of reversal indicators that work well together. This time we added the “Candle Studies” as another potential confirmation of an impending change of trend.
Recently we have been working with some of the components of these and other technical factors in an effort to find those important turning points, looking for sharp reversal opportunities within a trend. We are calling this the Key Reversal Indicator (KRI).
On Friday, September 14th the KRI was in an extreme position and was forecasting the potential for a quick change in trend within three to five days. So far, so good as that came about almost to the day of the signal. Since then the KRI has move back toward the equilibrium level, but still a holding within the overheated side.
Now, when studying the chart below, we can see that the readings from both the Trend/Stall and Spearman indicators are also providing a warning that markets may have to digest/consolidate a bit more in the near future. While the S&P 500 is still in an uptrend, this should be viewed only a wake-up call that, at a minimum, the index needs to cool off a bit – you know; trees don’t grow to the sky….
With the Spearman rolling over from above the +75 level, it is telling us that the momentum is down. It does not provide for any measure of how much or how long, but looking back in time, you can see that it does a pretty good job of following through on the directional move once it starts down from over extreme overbought levels.
The idea of a reversal is also confirmed by the Trend/Stall study that has been warning over the past nine sessions (pink bars) that a potential signal could triggered. In addition, the Candle Sessions Indicator has now posted a three count on the downside. (see below for further clarification of these to technical indicators)
Putting it all together: There is some room down to 1,446 on the S&P 500 if markets continue to roll. From there, look for 1,439 and 1,424 as key support levels.
Some clarification and definitions (Bloomberg Tech Analysis Group: Hat-tip Bill Sindel)
TrendStall identifies points at which a trend is losing momentum and is likely to stall or consolidate. The determination is based on a Rate of Change of the ADX. The parameters for the ADX, Rate of Change, and Moving Average of the Rate of Change are user adjustable.
The bar that has been determined to be the ‘Stall’ point is marked by a triangle above or below that bar. The price bars leading up to a TrendStall signal are painted a different color to alert the user that the TrendStall histogram has risen above the threshold level confirming a trend is in place and a stall is imminent. The period after the stall bar may also be painted on the price chart, depending on the value of the histogram (ADX ROC) in relation to a moving average of that value. This ‘paintbar’ period is often valuable as an indication of a slightly longer stall confirmation.
We have also put another reversal indicator which is based on Japanese candlestick counting. An underlying trend is established by comparing consecutive down/up candles to identify the Record Session Low/High. Thereafter a sequence of opposite moving candles based on High/Low breaks are recorded until the maximum count is reached or until a new Record Session Low/High is found. Potential reversals tend to occur at counts of 8, 10 or 13!


