
It has been a magnificent run for markets, gaining back much of what had been lost. The rebuilding process has been swift and, at times, very powerful. To their credit, much of the hard work has been done by the companies that hold the greatest weight in key indices. Take the NASDAQ 100 as a good example of this.
On what is now known as the post-pandemic trade, companies that have become beneficiaries of the work-from-home shift have been in favor. Many of these reside within the technology sector and had been thriving even before the Covid-19 outbreak. The advancements in technology have pushed companies to keep up with the latest and greatest innovations and consumers have become more reliant on tech for many of their needs.
So, as the lockdowns, and stay-at-home orders were issued, many of the top names that were already gaining market share went into overdrive. Names like Amazon, Microsoft, Google, and Apple were well positioned going into this global shutdown.
The NASDAQ 100 is a market-cap-weighted index. What this means is that companies with the largest market value hold the biggest positions in the index. So, trillion-dollar companies hold a disproportionately large weighting.
The table below shows the weight of the top-5 names in the NASDAQ 100 ETF (QQQ):
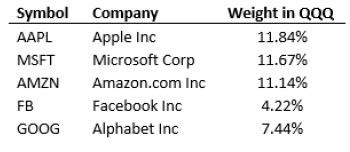
In other words, these five companies together account for more than 46% of the index. Since these are also the companies that have performed well before and during the pandemic, they have skewed the index returns significantly. For example, Apple is up 27% in 2020 through the end of June, Microsoft 30%, Amazon 60%, and Facebook 18%. No wonder why the NASDAQ 100 ETF is up 20% this year.
A similar situation has occurred with the S&P 500 index, although to a lesser degree. The same stocks that have dominated the NASDAQ returns are also high on the list within the S&P 500, another index that is market-cap weighted. What we know from this is that while the major stock indices have recovered a good amount of the losses since March 23rd, not all stocks have seen a similar trajectory. The large-cap indices are close to breakeven for the year, while the Russell 2000 small-cap index is still down 15%.
What we are seeing now is a bear market – the first time in over ten years that we have observed both an economic contraction and market correction of this magnitude. It is part of the cycle that moves from trough to peak and back again. It is natural that markets correct, and that the economy slows. However, not all bear markets or economic downturns are equal.
History has shown us that major market corrections come in many different sizes and flavors. Each one has its own peculiarities and reasons as to why it got started in the first place. If we were to look at past occurrences of market breakdowns, we could split them into three basic categories.
First, there is structural. Essentially this is the result of a market player or sector causing a systemic problem, such as over-leveraged banks or consumers. We could put the 2008-2009 financial crisis in this category.
Then there is the cyclical type which is more of a natural slowdown in economic activity after a period of growing production and profits. The early 1980s is probably the best example of this type of downturn. After nearly a decade of sustained inflation, the Federal Reserve raised interest rates to nearly 20 percent, pushing the economy into a recession. The combination of high inflation and slow growth — known as stagflation — was a factor behind the market drop of 27% and 21 months of economic sluggishness.
Finally, we have an event-driven market and economic disaster type. This is largely what we are seeing play out right now, with an unpredictable shock to the markets, such as a natural disaster or health crisis. This sort of economic condition is usually the worst and the best, all rolled up into one. It is the worst because no one can see it coming. In the situation of a natural disaster or the current case of a pandemic, it is not something that is highly predictable. Thus, creating a significant amount of uncertainty and massive market volatility.
On the other hand, it is one of the “best” types as the deep market correction is often a temporary condition. While the shock may hit markets hard, it is usually over faster than any of the other types of bear markets. Additionally, event-driven disasters also have the ability to turn into a structural breakdown. As the economy slows due to the event/disaster, if there is not enough fiscal or monetary support sectors that are more susceptible to economic change could become problematic causing a downward spiral. This is why it was so important to see coordinated efforts from both the Federal Reserve and the U.S. Government come to the rescue so quickly.
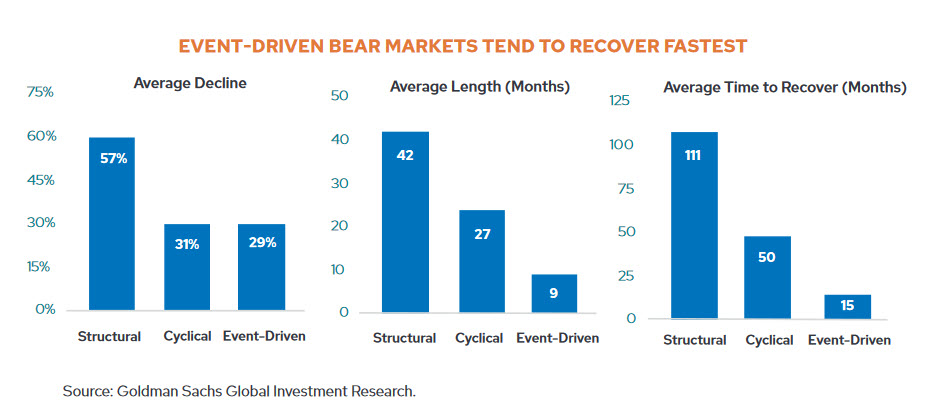
Naturally, there is no specific rule as to the length or depth of the damage that spins off any of these economic storms. We also don’t have any idea how far governments are willing to go to provide stimulus and market supportive measures. However, we do have some historical precedent as to average declines for the stock market, recovery, and months that the pain will last.
While there are only a handful of bear markets throughout history that we can glean data from, the notion that event-driven bear markets can recover quicker than structural bear markets makes sense. On average, the historical recovery time from the lows back to the highs has been 15 months. With the current market, the NASDAQ did it in less than 3 months. The S&P 500 is still working on getting back to its previous high that it achieved in February 2020 and the Russell 2000 small-cap index has its work cut out for it.
Obviously, this pandemic needs to get resolved before investors and consumers can regain their full confidence in the economy. The recession that we find ourselves in, just like every recession of the past, feels like the worst one ever. Even as the stock market and the economy have dislocated, there is still a great deal of economic pain that is widespread and far-reaching. Job losses and business closings are just the tip of the problems that millions of people are dealing with on a daily basis.
As investors, we know that eventually, we will experience a market downturn. As individuals and consumers, we also have a great deal of evidence that shows us that periods of recession typically do not last long, and the stock market has a way of recovering over the long-haul.
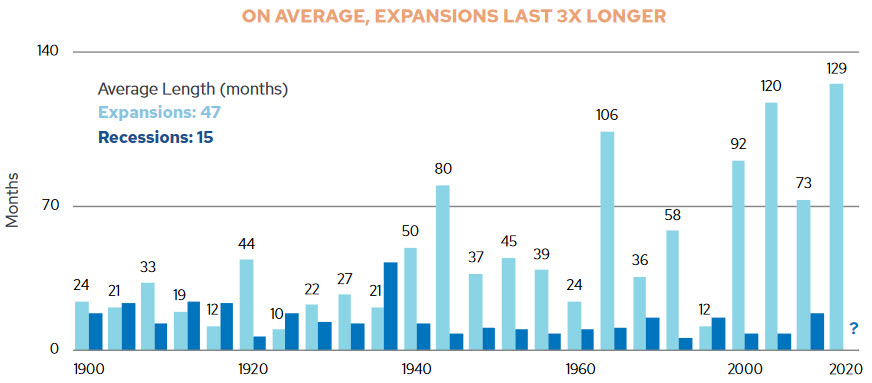
In fact, if we want to look at the cup as half-full, we can see that, on average, expansions last about three times as long as recessions. As long as your risk tolerance is matched with an appropriate timeframe, there is a good chance that, over time, you will have a much greater chance of expansion than contraction.


