

The Debate Continues: Passive or Active for Fixed Income?
Over the years, there has been a robust and healthy debate within the investment community focused on the benefits of passive vs. active investing. Historically we have taken the position that, within the fixed income space, active strategies are generally the preferred method to gain asset class exposure. Nevertheless, it is important to retest this thesis over time to ensure it continues to be a viable and beneficial stance for client portfolios.
There are important distinctions between an active and passive investment philosophy. Within this study we are primarily focusing on active and passive investments through mutual funds and ETFs. As a quick review, an actively-managed investment fund may have one or many managers that are responsible for making opportunistic investment decisions. The process often involves a specified research process, fundamental and/or technical analysis.
On the other side of the spectrum, passive fund management usually has a process that simply involves buying and selling investments to closely mirror a specific index or benchmark. The goal is to provide returns that are as close to the index as possible.
As a baseline for the study, we started by reviewing key performance and risk/return metrics from seven of the major Morningstar fixed income categories which include:
- Treasury Inflation Protected Securities (TIPS)
- High Yield Bonds
- Intermediate Term Bonds
- Short-Term Bonds
- Bank Loans / Floating Rate Securities
- Emerging Market Bonds
- World Bonds
Actively managed strategies within these categories were then evaluated against their respective passively managed counterpart. The goal was to compare actual investable strategies against one another rather than simply looking at how they fared against a static benchmark. It is important to note that within the fixed income space, meeting, beating and replicating a benchmark can be very difficult. This is due to several possibilities, but the main factors include the following:
- Fixed income benchmarks often have extensive turnover and therefore the replication process can be extremely costly due to transaction fees.
- Adding to the above, benchmarks often do not take into consideration market illiquidity, transaction costs or slippage. These three items will undoubtably impact overall performance. Unlike equities, bonds can be extremely illiquid and/or have very wide bid/ask spreads which, over time, may cause a passively managed index to exhibit significant tracking error.
We therefore believe that while it is important to compare fixed income funds to their respective benchmark, it is equally important to judge them against both their peers and their passively managed counterpart.
Additionally, fixed income benchmarks are inherently flawed.
- Benchmarks frequently give a larger weighting toward countries and companies that issue more debt. This is very different from most equity indices which give higher weightings toward companies that have larger market capitalizations.
- Many times, fixed income benchmarks do not include a large portion of bonds that can be invested in. As a good example of this, the Financial Times recently wrote; “Because the US Aggregate does not include bonds not blessed by the rating agencies, inflation-linked bonds and foreign currency bonds, passive products exclude roughly two-thirds of the US fixed income market.”
Fixed income investing serves many different masters. There are several entities involved in the marketplace that, believe it or not, are not buying and selling fixed income products with profit as their primary objective. This next point may be even more surprising to some: according to the Financial Times, “It has been estimated that over half of the global bond market is comprised of such entities.”
As we have clearly seen over the past decade, there are many instances of programs buying or selling bonds based solely on mandates. Examples of these include agencies, such as central banks, that are buying and selling government or agency-backed securities in an attempt to control inflation or spark economic growth. Think about the quantitative easing program the Federal Reserve conducted in an attempt to supercharge growth for the U.S. economy. Sovereign nations may also buy and sell bonds in order to control currency fluctuations or perhaps maintain currency reserves. Financial institutions may have regulatory mandates that they need to abide by as well as future obligations that will need to be paid off. The latter is called asset-liability matching, which is used by many financial institutions and by insurance companies.
With all of this in mind, let’s take a look at the construct of our research process:
Throughout this study, we evaluated several different scenarios which included: All funds within the specific Morningstar category with more than 10-years of performance history, institutional funds with more than 10-years of performance history as well as institutional funds that have performed in the top 75% over the last 3-, 5- and 10-years. This last point needs some clarification as our intent was to include funds that have consistently performed well over time. The main takeaway is that we were not looking to cherry pick managers and therefore believe that focusing on the top 75% of funds based on performance was most appropriate for this study. In other words, not the top 10% or even best 50% of funds, but the top 75% of funds based on total returns for a 3-, 5- and 10-year basis.
Our overarching goal was to test our baseline theory in a situation which would specifically result in actual portfolio returns that investors or portfolio managers could reasonably achieve by picking a quality manager from the vast number of fixed income funds available. Then, compare that to a passively managed strategy to see if there was any benefit.
So, to review… Each category of funds was evaluated and compared over a 3-, 5- and 10-year basis. We went one step further and reviewed daily 3-year rolling returns of the funds in the top 75% of each category to make sure we weren’t looking at a snapshot aberration within the dataset.
Additionally, these performance metrics were weighed against risk/reward characteristics through the evaluation of standard deviations, Sharpe Ratios and Sortino Ratios, commonly defined below:
Standard Deviation:
The standard deviation is a statistic that measures the dispersion of a dataset relative to its mean and is calculated as the square root of the variance. If the data points are further from the mean, there is higher deviation within the data set; thus, the more spread out the data, the higher the standard deviation. The greater the standard deviation of a security, the greater the variance between each price and the mean, which could indicate more volatility or variability of returns.
Sharpe Ratio:
A risk-adjusted measure that calculates the excess performance with respect to the risk-free rate, per unit of volatility over the time frame. Performance is measured as mean return. The higher the Sharpe Ratio, the better the historical risk-adjusted performance.
Sortino Ratio:
A modification of the Sharpe Ratio that differentiates harmful volatility from general volatility by considering the standard deviation of negative asset returns, more commonly referred to as downside deviation. The Sortino Ratio subtracts the risk-free rate of return from the portfolio’s return, and then divides that by the downside deviation. A larger Sortino Ratio indicates there is a lower probability of a large loss.
THE RESULTS
Short-Term Bonds / Low Duration
As investors have been projecting yields to rise, shorter-term bonds have come back into favor. Previously, many years of quantitative easing and accommodative policies had pushed allocations into longer-term bonds as a way to generate meaningful yield. However, now that rates are actually beginning to rise convincingly, and the yield curve has begun to flatten, investors have been seeking out shorter-term bonds in order to combat the risks related to principal loss. Fixed income’s inverse relationship of price/yield has now begun to reverse its course in the form of interest rate risk. As rates rise, the opportunity cost of holding a bond with a lower interest rate means that it is worth less than a newly issued bond with a higher yield.
With that as a backdrop, let’s take a look at how the short-term bond category constituents fared against their passive counterpart.
Of the total 236 funds within the category:
- Over a 3-year period, 72% of the actively managed funds beat their passive counterpart with an average annualized outperformance of 0.51% or total return of 1.53%. Additionally, this was achieved with much better risk/reward characteristics as exhibited through a lower average standard deviation, a 0.52 higher Sharpe Ratio and 1.02 higher Sortino Ratio.
- Over a 5-year period, 56% of the actively managed funds beat their passive counterpart with an average annualized outperformance of 0.09% for a total return of 0.47%. Moreover, this was achieved with much better risk/reward characteristics with a lower standard deviation, a 0.25 higher Sharpe Ratio and 0.55 higher Sortino Ratio.
- Over a 10-year period, 58% of the actively managed funds beat their passive peer with an average annualized outperformance of 0.19% for a total return of 1.89%. Furthermore, this was achieved with generally better risk/reward characteristics revealed by an average standard deviation equal to the passive counterpart, a slightly lower Sharpe Ratio but a 0.25 higher Sortino Ratio.
The resulting factors above were even more impressive when considering the fact that the expense ratio of all funds within the category averaged 0.78% higher than the passive complement.
Institutional funds within the category:
- Over a 3-year period, 92% of the actively managed funds beat their passive counterpart with an average annualized outperformance of 0.94% or total return of 2.85%. Additionally, this was achieved with significantly better risk/reward characteristics through a lower standard deviation, a 1.02 higher Sharpe Ratio and 2.06 higher Sortino Ratio.
- Over a 5-year period, 87% of the actively managed funds beat their passive comparable with an average annualized outperformance of 0.49% or total return of 2.50%. In addition, this was achieved with much better risk/reward characteristics exhibited on average with a lower standard deviation, a 0.76 higher Sharpe Ratio and 1.59 higher Sortino Ratio.
- Over a 10-year period, 83% of the actively managed funds beat their passive peer with an average annualized outperformance of 0.65% or total return of 6.65%. At the same time, this was achieved with much better risk/reward characteristics showing a standard deviation equal to the passive benchmark, a 0.25 higher Sharpe Ratio and 0.86 higher Sortino Ratio.
The benefits above are respectable even in the face of the average expense ratio of institutional funds within the category 0.43% higher than its passive correspondent.
Top 75% Institutional funds within the category:
- Over a 3-year period, 100% of the actively managed funds beat their passive counterpart with an average annualized outperformance of 1.04% or total return of 3.14%. Additionally, this was achieved with much better risk/reward characteristics, showing a lower average standard deviation, a 1.12 higher Sharpe Ratio and 2.29 higher Sortino Ratio.
- Over a 5-year period, 98% of the actively managed funds beat their passive equivalent with an average annualized outperformance of 0.57% or total return of 2.90%. This was achieved with superior risk/reward characteristics exhibited by a slightly lower standard deviation, a 0.85 higher Sharpe Ratio and 1.80 higher Sortino Ratio
- Over a 10-year period, 95% of the actively managed funds bested their passive peer with an average annualized outperformance of 0.82% or total return of 8.55%. Correspondingly, this was achieved with greater risk/reward characteristics with an average standard deviation equal to the passive counterpart, a 0.27 higher Sharpe Ratio and 0.87 higher Sortino Ratio.
It is important to take note of the outperformance and risk/reward characteristics even as the average expense ratio of institutional funds within the category are 0.43% higher than the their passive alternative.
Below is a table view which condenses the data as described above. This may help to codify the results in a friendlier way. Cells that are shaded in green represent observations in which active management provided a benefit. Cells that are shaded in red signify conditions when active management fell short of the passive strategy benchmark. In other words, this provides a good summary of the relative benefit (or detraction) of active vs. passive management for the sector.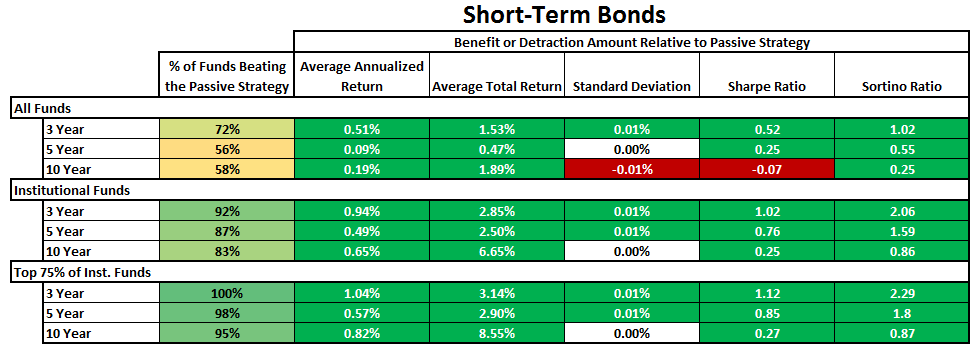
In reviewing the rolling 3-year daily performance within this category for the top 75% of institutional fund managers, active managers beat out their passive counterparts 79% of the time. The results were taken from an observable dataset which included a total of 89,676 instances. The net average outperformance for active managers clocked in at +0.89%.
Below is a graphical representation that illustrates the distribution of under-/out-performance for Short-Term fixed income mutual funds relative to the corresponding passive investment option. In this chart, the X-axis provides a specific range of returns (<-3% to >+3%). The corresponding Y-axis shows the percent of times in which the individual instances outperformed. Note that on the X-axis, positive returns indicate relative outperformance by the active managers. Negative returns indicate relative underperformance by the active manager. Therefore, if the passive strategy produced a 3-year rolling return of 5.00% and the active manager produced a return of 7.50% this would indicate an outperformance of 2.50% and would be shown in the 2% to 3% range on the X-axis.
Using the chart below, we can see that active short-term managers outpaced the passive strategy by a measure of between 1% to 2% on a 3-year rolling basis 17.58% of the time. You will notice that there were only a few times that the passive strategy beat out its active counterpart and when it did, it was by a negligible amount of between 0 to 1%.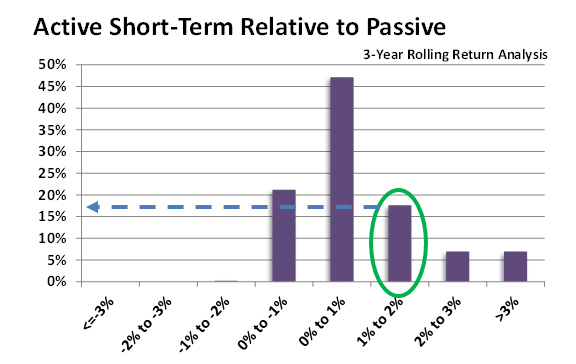
Treasury Inflation Protected Securities (TIPS)
TIPS have seen relatively muted performance as of late as the Consumer Price Index (CPI) has continued to hold well below 3% for the better part of the past decade. Low inflation has been a global phenomenon even with interest rates below historical norms. As the Fed continues to remove accommodations and hike rates, inflation is expected to remain anchored. However, should inflation begin to overheat, TIPS is a fixed income sector that may benefit. The table below outlines how actively managed TIPS have performed against their passive benchmark:
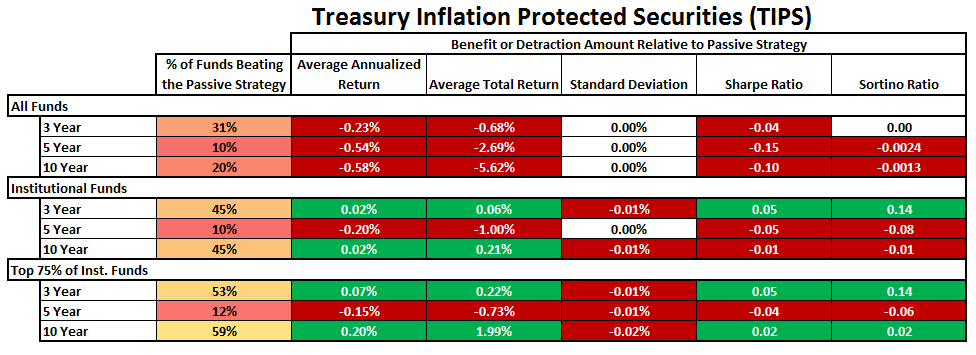
It is very easy to see the relative underperformance of active portfolios within this sector. Actively managed TIPS have struggled to beat their passive counterpart even among the top 75% of institutional based funds. Part of this can be attributed to fees as the average annual expense ratio for all funds within the TIPS category is 0.68% higher than the passive strategy. Despite the lag in performance, there are still some funds within this category that consistently outperform the passive counterpart. It is very obvious that, within the TIPS category, keeping fees low is certainly an important component of fund selection.
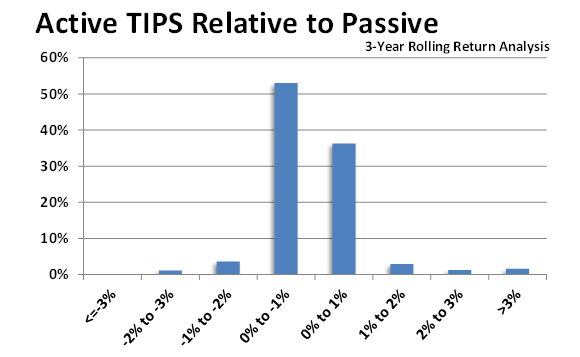
Observing the daily 3-year rolling performance, notice that about 42% of the time, actively managed funds outperformed the passive strategy. Approximately 53% of the time it lagged by a margin of between 0% to -1%. Once again, this confirms that expense ratios have been the major obstacle hindering performance against the passive strategy.
High Yield Bonds
High yield bonds have been in favor over the past 5-10 years. With overall interest rates remaining near historic lows, investors have been forced into lower quality securities for the purpose of satisfying their income needs. That being the case, there has been quite a bit of opportunity for active managers to exploit opportunities within this market sector. This is certainly reflected in the results below.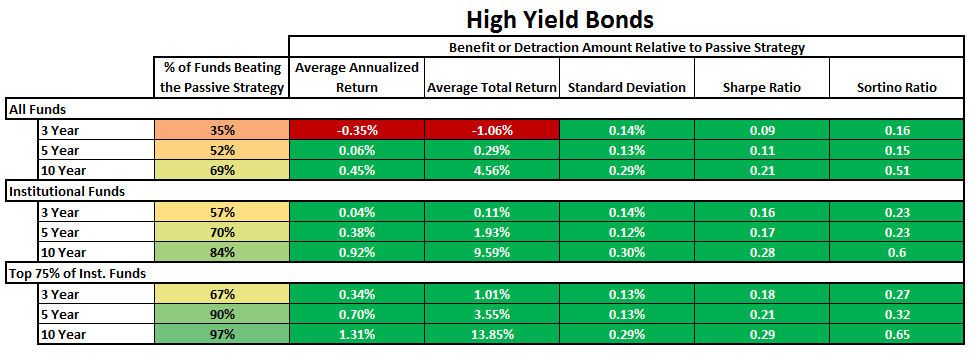
While most funds within the category have shown a proclivity to beat their passive counterpart, as we move toward the top 75% of institutional funds, we see that lower fees and investment selection increase the likelihood of active managers besting the passive strategy. This occurs with better risk/return metrics through the Sharpe and Sortino Ratios. This appears to be a fixed income sector in which the utilization of active management provides a high confidence factor – even as the average of all funds within the category have a 0.61% higher annual fee than the passive strategy.
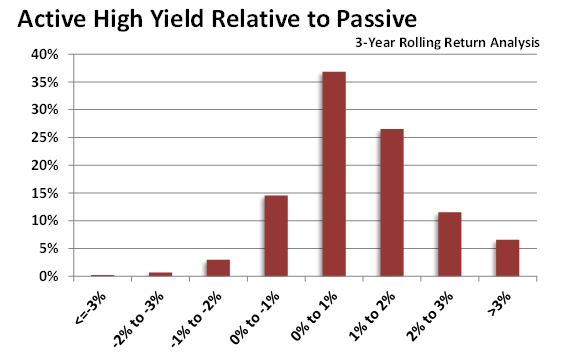
Moving to the daily 3-year rolling periods, note that the top 75% of institutional funds beat out the passive peer more than 80% of the time.
 Bank Loans / Floating Rate
Bank loans, sometimes referred to as floating rate securities, have been in favor recently as rates have been rising. These securities generally have the characteristic of being lower in quality, but also have a function where the interest rate floats or resets after a period of time. As rates continue to rise, these particular securities may exhibit somewhat less interest rate risk as compared to other fixed income sectors. Prior to 2008 this was not an area within the fixed income sector that was utilized extensively and therefore not many fund managers within the space have extensive historical data available. That being the case, there is a much smaller dataset to base our research on.
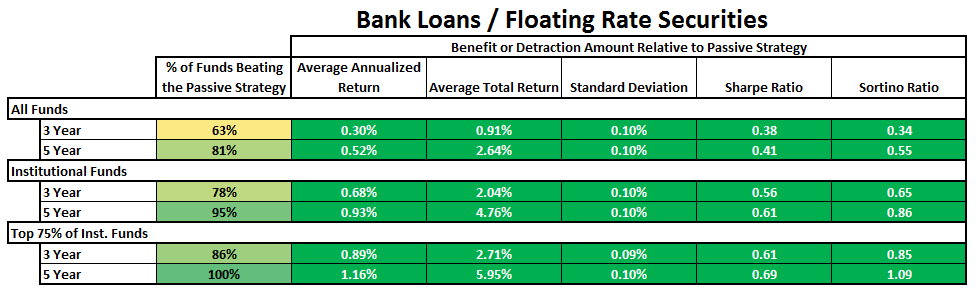
Generally, active managers in this sector outpaced the passive strategy and did well on a risk adjusted basis. As we move further down to the top 75% of institutional funds, we see an even greater disparity of returns as active managers were able to capture substantially better annual performance. In fact, they averaged 5.95% more as compared to the passive strategy over a 5-year period. Even more impressive is the fact that fees for all funds within this category average 0.47% higher on an annual basis than the passive counterpart.
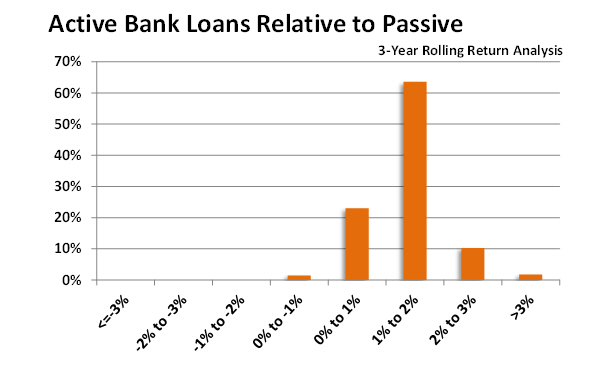
Looking at daily 3-year rolling returns back to 2008, we note that 98% of the time, the top 75% of institutional managers bested the passive strategy. This is extremely impressive and leads us to believe that this is an area within the fixed income allocation where active management should be highly considered.
 Intermediate Term Bonds
This category is considered the most popular bond segment within the industry and is generally benchmarked to the Barclay’s Aggregate Bond Index. As a matter of fact, it is often considered a “core” bond holding for many investors that include a fixed income allocation for portfolios. Active bond fund managers are typically utilizing investment grade bonds across a range of maturities as well as various sub-strategies in an attempt to best the benchmark. Within this category, there are a number of ways a skilled active manager can attempt to exploit market inefficiencies to add value over time. This can easily be recognized in the results from the table below: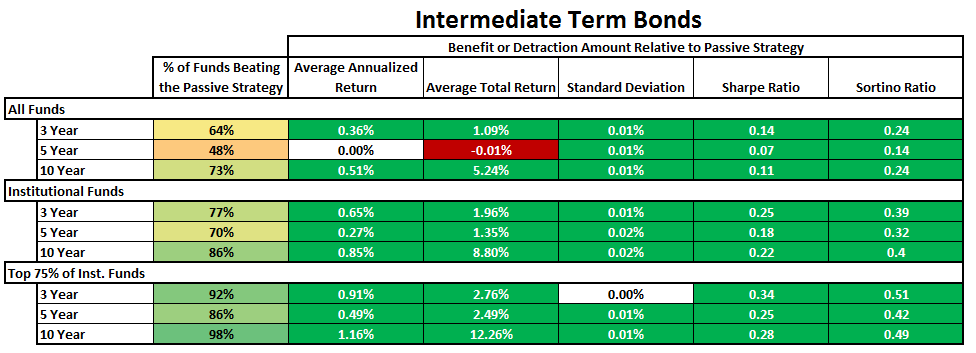
As you will notice, the preponderance of green spread throughout the table indicates active management providing better returns with less risk than the corresponding passive strategy. Interestingly, when reviewing the results of all the actively managed funds within the category over a 10-year time span, there is an average annual total return of greater than 5%. Within the top 75% of institutional funds, we are observing an even larger disparity of a little over 12% for the same 10-year period. The outperformance is more interesting given the fact that, across all funds in this segment, the annual average fee is 0.81% higher than the passive strategy.
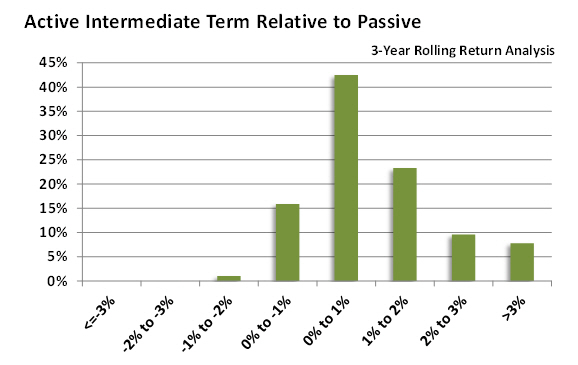
Over a 3-year daily rolling period (going back to 2006), the top 75% of institutional funds have beaten the passive index over 83% of the time – which is rather impressive.
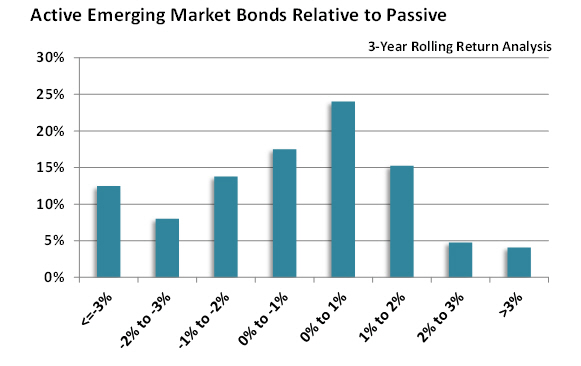
Emerging Market and World Bonds
Within these two separate categories there is a large divergence in performance between the passive and active strategies. Our overall findings show that performance for passive strategies generally prevail. This came as a bit of a surprise to us as generally we would think this is an area where active managers should thrive. However, it is important to note that there are a variety of reasons as to why this may be the case.
While foreign and emerging bonds can have similar risk characteristics to domestic bonds, they also may carry currency risk. What this means is that certain actively managed funds may trade in the local currency and others may be dollar hedged. With the recent strength of the U.S. dollar, it is not that surprising to see many of the active funds within the category, which hold securities in the local currency, to be lagging. Additionally, the makeup of each of these strategies can be extremely diverse, especially within the World Bond category. World Bond funds can be comprised of both foreign and domestic bonds.
This can be problematic when trying to make an apples to apples comparison. While we are surprised by the outcome, we also know that there are several factors which make it difficult to accurately compare an active strategy to a passive one within this particular category.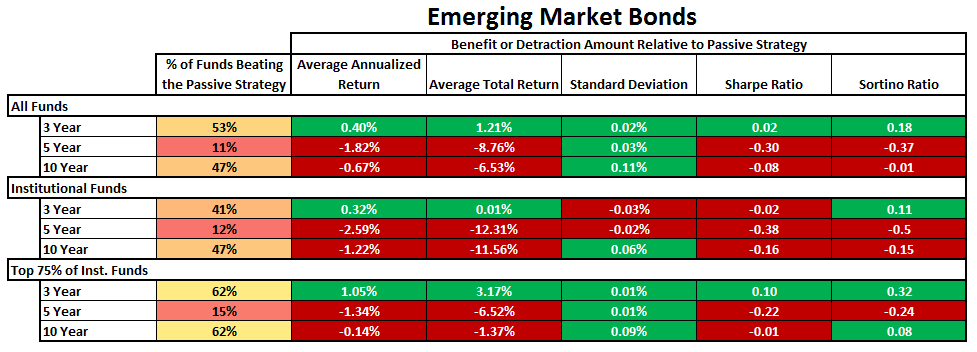
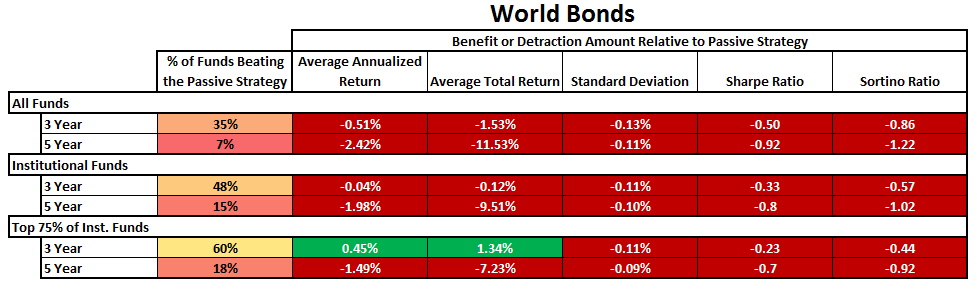
It is a similar result when looking at the daily 3-year rolling periods for both of these categories where we observed a wide range of results:
SUMMARY
In summary, we believe that it is pretty safe to say that active management within Short-Term, Bank Loans, Intermediate Term and High Yield is a good path to consider. We also have some confidence in the notion that while the data shows results for TIPS leaning toward passive management, we have the understanding that skilled mutual fund selection may assist in beating the passive strategy.
Within World Bonds and Emerging Market Bonds, we are still on the fence. We argue that there are too many factors that don’t necessarily provide an equal comparison against the passively managed strategies. While on the surface it would seem that going with the passive strategy would be a better option, we would also argue that the decision may depend on a variety of factors such as currency risk and the overall makeup of the specific manager’s strategy. Thus, depending on the economic environment, this may be something the investor will need to evaluate.
FINAL THOUGHTS
One thing we can say for certain after completing this exercise; it isn’t always about getting the lowest cost fund to do the job. Rather, it is imperative to find the right balance of a good manager at a reasonable price. Access to institutional funds, which inherently have lower fees (like the ones we utilize extensively for client portfolios at Horowitz & Company) can greatly increase the chances of winning against peers and passively managed strategies. It is also a wise idea to combine those with passively managed and low-cost alternatives (ETFs) when there is no apparent benefit of active management within the portfolio construction.
Notes:
Data for historical periods is as of October 2018.
When referring to “passive” throughout this discussion, index-based ETFs have been used as the comparative benchmarks as follows:
Category / Symbol
TIPS / TIP
Bank Loan / BKLN
High Yield / HYG
Emerging / EMB
Intermediate / AGG
World Bond / BNDX
Short-Term / BSV


