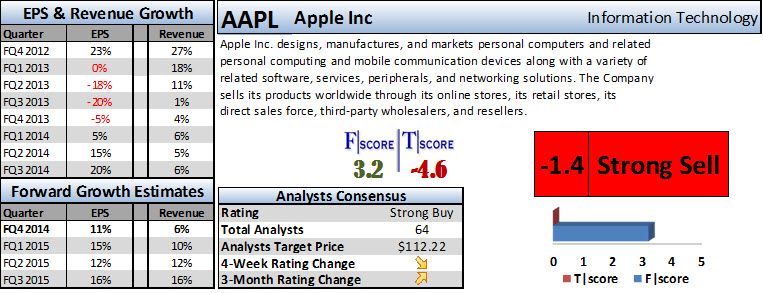
Despite overall market weakness, Apple Inc. has held up fairly strong. This should be attributed to the expectation of strong sales for both the iPhone 6 and 6+ models. In addition, yesterday we saw the new release of the iPad Air 2, iPad Mini and new MacBooks. It was good to see they are keeping all three generations of iPad Mini’s on the market for sale at much lower price points. This should increase their competitive stance against other potentially inferior Android and Amazon tablets.
There have been some concerns recently about the lack of real innovation and returning the massive amount of cash they have on the balance sheet to shareholders. This will most likely be discussed in the upcoming quarterly earnings call which occurs on 10/20/2014 after market close. While our score below is low, this is mostly due to the declining technicals in the share price which could turn on any moments notice after earnings as fundamentals still remain strong.
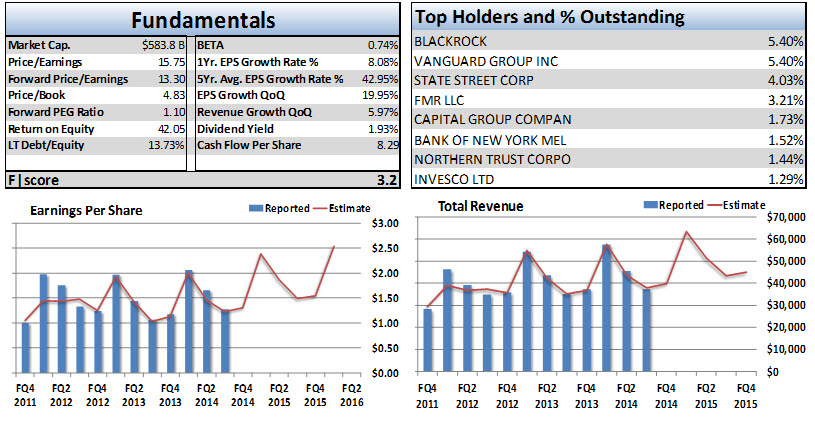
Horowitz & Company’s proprietary Fundamental Scoring System (F|score) takes into consideration many factors related to each company’s financial history and outlook. This system is oriented toward a growth model and therefore will give a higher score to those companies which continually show increasing earnings per share and revenue over time. Over the long-run (and when looking to purchase a security) we prefer companies with a track record of growth and solid fundamentals. In the short-term however, it is price / technicals that pay. When investing, we combine both of these analyses to seek out possible investment opportunities within our universe of stocks.
This stock ranks below average in fundamentals and would not be considered an option that we would invest in the long-term. For those with a higher risk tolerance, it is possible to enter a speculative position with caution as this market has been much about bottom feeding on the worst of the worst companies. See below for details on where this company thrives and possibly some of the drawbacks:
We find that EPS Growth on a Quarter over Quarter basis is one of the strongest components when screening for growth stocks. Continued EPS Growth in a company generally shows strength in leadership, the ability to manage expenses and improve the bottom line. Over the last three quarters, this company has not done as well producing EPS Growth Rates last quarter, 2 quarters ago and 3 quarters ago 19.95%, 15.17%, 4.99% respectively.
Revenue Growth similar to EPS Growth is also a strong component to consider when screening and scoring for growth companies. Continued growth in revenue shows that the company is innovative, marketable and its products remain relevant in the marketplace. Over the last three quarters, this company has not done as well producing revenue growth rates last quarter, 2 quarters ago and 3 quarters ago 5.97%, 4.69%, 5.65% respectively.
The 5 Year EPS Growth Rate has added to the fundamental score with a value of 42.44.
Last quarter this company reported Earnings per Share 3.98% better than analysts had expected. We believe this surprise, although only for one quarter, could set a trend for future earnings reports and guidance.
Price relative to earnings growth is commonly referred to as the PEG Ratio. This company may contain added value as its PEG Ratio is 1.10. We generally would like to see the PEG ratio under 1.5 and it is even better if it is under 1.0.
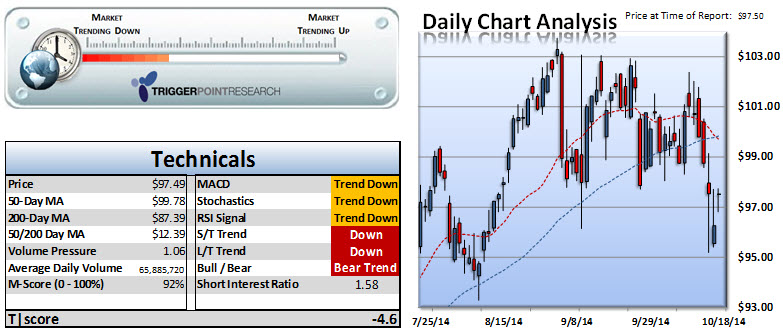
Horowitz & Company’s proprietary Technical Scoring System (T|score) takes into consideration both individual security technicals as well as the overall market direction when considering whether or not to purchase a company. H&C’s Market Trend Indicator (MTI) is a measure which is designed to evaluate the overall trend in the market. There are four designated levels to assess the trend which include: Strong Downtrend, Downtrend, Rally and Strong Rally. We are currently in an environment where the MTI is in a Strong Downtrend. All of our indicators are showing that the markets are in an unfavorable position for most securities. During this time it is best to only venture into those stocks with the strongest of technicals. It is advisable to invest cautiously during this time frame. With that in mind, this stock ranks in the mid to below average percentile of stocks from an individual security technical score. H&C would not consider purchasing this position in any general market with the exception of a Strong Rally. H&C would be hard pressed to purchase this position even in a Strong Rally considering all other companies that may score higher technically in our growth model.
Below are some of the key technical areas where Apple Inc (AAPL) excelled or detracted from the value of the T|score:
Stochastics are currently showing some bearish attributes which may mean this stock is slightly overbought in the short run.
During the past two weeks, Apple Inc (AAPL) has crossed below its 50 day moving average. We see this as a bearish sign as the momentum is starting to change.
In terms of price and volume especially over a short period of time it is important to see if there is any weight behind either a rally or correction. The stock has shown to have less than favorable price and volume action and may have a higher potential to move lower if the overall market and economy are to trend lower. Higher volume with negative price also will provide resistance levels for this position if it were to rally back to these levels.
On a 12-month rolling period, this company has performed very well when comparing against its peers and equities in the S&P 1500. This is a positive sign for this company as it shows strength relative to the overall market.
H&C currently sees Apple Inc (AAPL) in a Short Term Downtrend and Long Term Downtrend.