![]()
The Key Reversal Indicator (KRI) provides a methodology for indicating when “markets” are overbought or oversold. The algorithm looks at several factors to calculate a value that weighs the potential for a reversal. Now the KRI is available on the Tradestation Strategy Network.
This indicator can be used in conjunction with market timing or trading in order to better understand the trend as well as the potential for contra-trend positioning.

When markets become overheated/oversold and cluster formations appear on the chart, there is a very high probability that a market reversal may occur within 1-3 days.
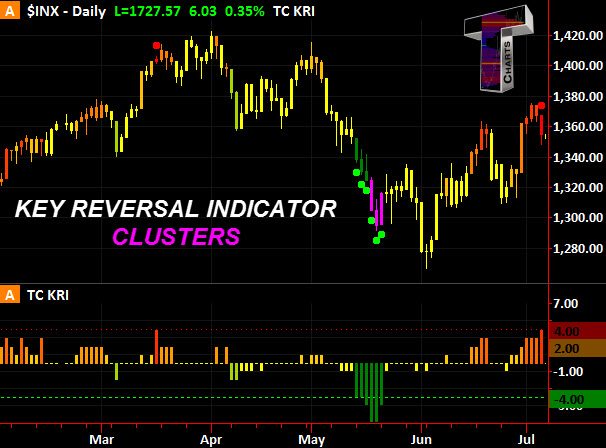
Traders can use these signals as opportunities to enter a position against the trend, looking to profit from the potential reversal.
Investors can benefit by looking to close positions or hedge out risk of a short-term change in trend.
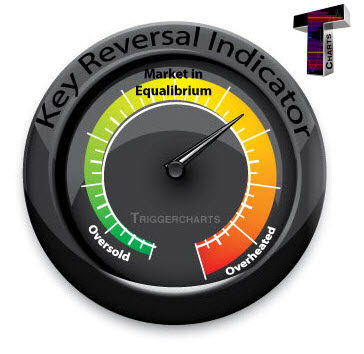
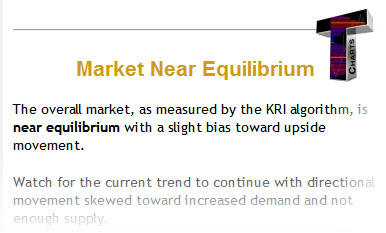
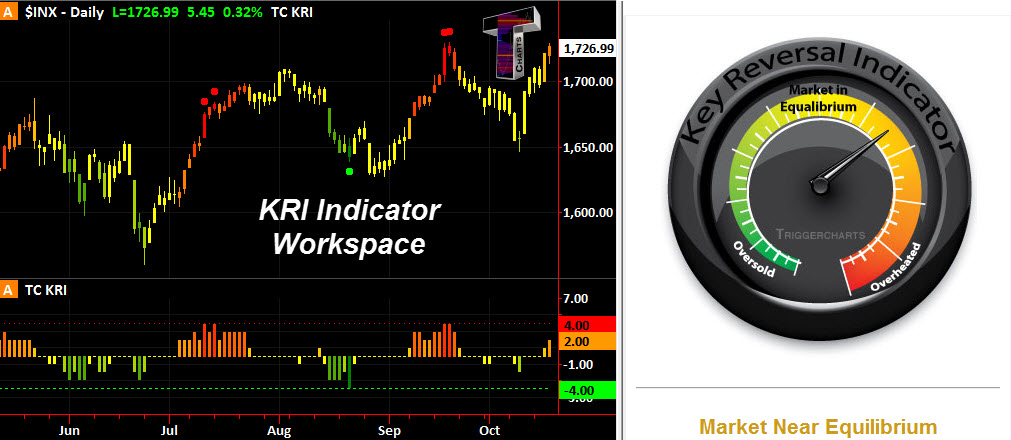
TriggerCharts Key Reversal Indicator combines a workspace with a chart showing the intensity of the trend as well as a historical view of the daily reading. In addition, the KRI gauge is an easy way to get a quick read on levels at a glance and a full explanation of the current level.
 |
 |
Alerts on conditions approaching overheated and oversold levels are pre-set with voice announcements.
Available om the Tradestation Strategy Network