This earnings season for the DJIA has come to an end. Now we have the job of looking at the final numbers and trying to assemble an outlook. Even though this index represents only 30 stocks, it provides us with a good measure of results to analyze.
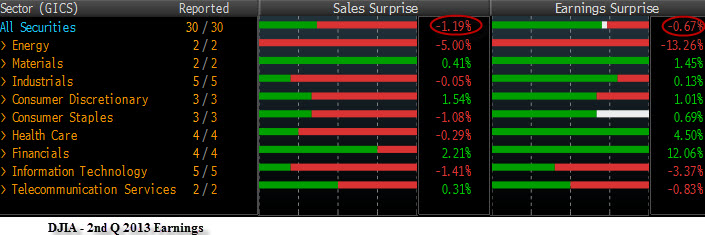
The first chart reveals that while the “beat” ratio of stocks was about 70%, earnings (EPS) missed by 0.67%. Sales on the other hand were far worse as most companies missed estimates and the actual results were 1.19% lower than analysts had predicted.
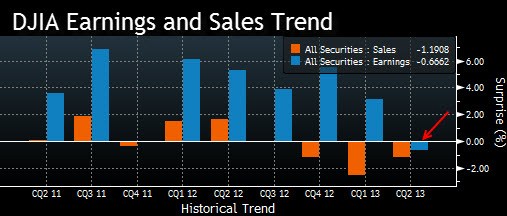
Moreover, the trend of earning and sales are slowing as well.
Now, take that and let’s look back on the past three months as to the markets levels to see if there is a correlation to fundamentals.
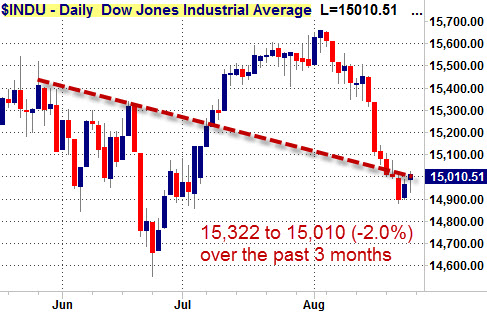
Actually, not a bad correlation as the earnings drop is somewhat on par with the price move. The P/E , multiple of the index (14.39) is also trading within the long-term average. This is much better than the Russell 2000 or the S&P 500. With many managers warnings about future headwinds, there is going to be some really good news needed to move this much higher by the end of the year.