We have covered this before, but now there is a much different look to the charts as Japan has tried to undercut every currency in order to kick start their economy.
Technicals are on thing, but in the end fundamentals should be the real driver of a currency. In order to get a better read on the valuation of a country’s currency, we can use the effective exchange rate. Over time this should not deviate to much from the center-line average. When it does, there should be a reversion back.
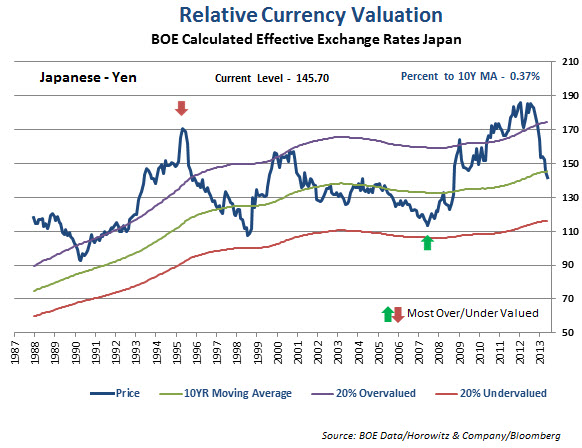
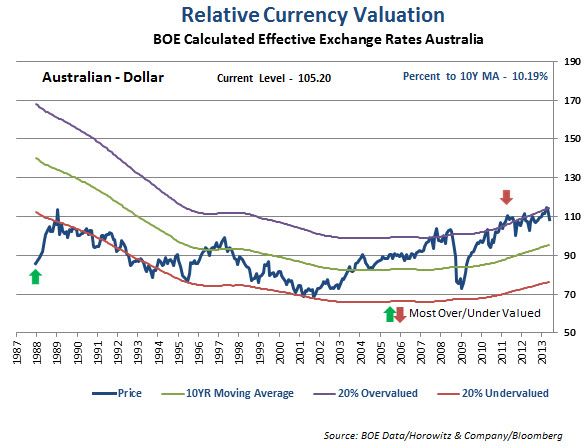
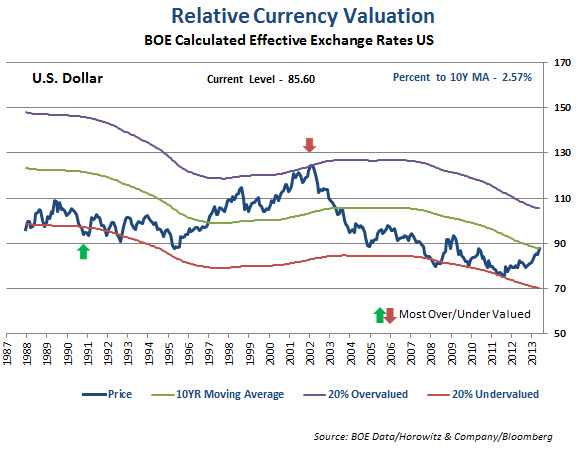
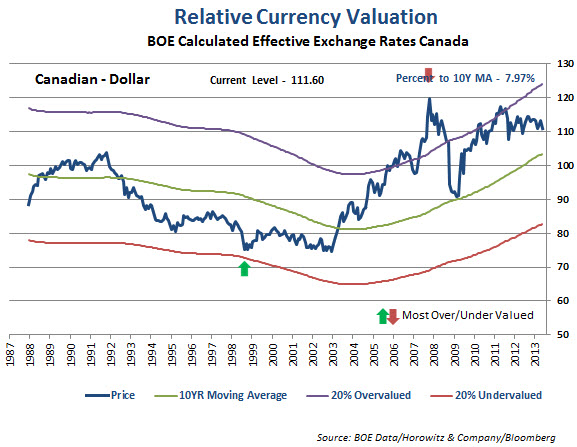
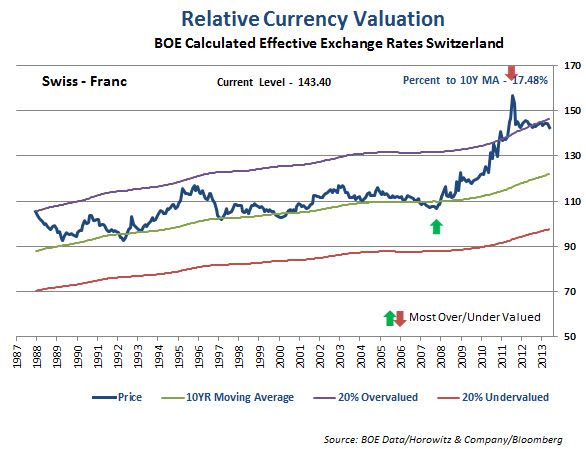
An effective exchange rate is a measure of the value of a currency against a `basket’ of other currencies, relative to a base date. It is calculated as a weighted geometric average of the exchange rates, expressed in the form of an index. The effective exchange rate indices for sterling and other currencies published by the Bank are based on the method the IMF uses to calculate effective exchange rates for a number of industrialized countries.
The weights used are designed to measure, for an individual country, the relative importance of each of the other countries as a competitor to its manufacturing sector. The trade weights reflect aggregated trade flows in manufactured goods for the period 1989 to 1991 and cover 21 countries. The base date for the index is 1990, and is set at 100.