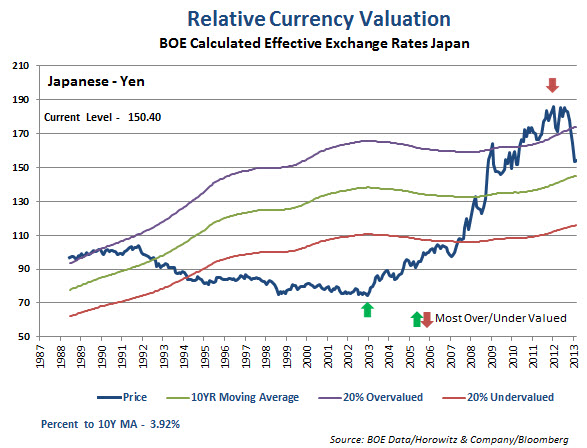
We are looking at the Effective Exchange rate for the Yen. The Japanese directive to debase the currency at any cost is already starting to create some ill will amongst countries. Recently, China and Germany have been vocal about the extreme move of late, which has brought the Yen down by more than 15% over the past months. (Of course the impotent IMF and G20 did nothing but exacerbate the situation by keeping silent on the matter)
Whatever the case and however this plays out with the next wave of protectionism, the chart below shows us the potential for where the YEN will stop it’s decent. Getting back to the 10 Year moving average for the Effective Exchange rate will mean another 3.92% downside, coinciding with the price level of 100 USD/JPY.
Before that, we expect some nudging by the world at large as this kind of move is not in the best interests of most countries.
An effective exchange rate is a measure of the value of a currency against a `basket’ of other currencies, relative to a base date. It is calculated as a weighted geometric average of the exchange rates, expressed in the form of an index. The effective exchange rate indices for sterling and other currencies published by the Bank are based on the method the IMF uses to calculate effective exchange rates for a number of industrialized countries.
The weights used are designed to measure, for an individual country, the relative importance of each of the other countries as a competitor to its manufacturing sector. The trade weights reflect aggregated trade flows in manufactured goods for the period 1989 to 1991 and cover 21 countries. The base date for the index is 1990, and is set at 100.