In our latest quarterly publication of the Economic Review and Commentary, we took a good look at the Economic surprise index from several regions.
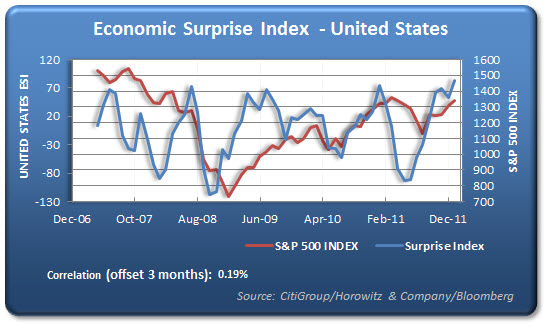
What we were seeking was relationships (if any) to the equity and fixed income markets as it is commonly known that markets are often forward looking. The chart below shows the U.S.surprise index as compared to the S&P 500 index. We found that there is a better correlation between the S&P index and the surprise index when offset by 3 months. In other words there are often times that the two become misaligned but markets often move in advance. (Several other regions had better correlations)
Needless to say, the markets have had it right so far. The most recent economic reports show just how far off economists are with their predictions and how right the markets have been. (We were also way off the mark with our below consensus NFP estimate.)
If we continue to see a trend of surprises to the upside, economist will penguin their estimates higher to adjust for their miscalculations. At that point, it will be interesting to see how off the mark they are and if it will lead to downside surprises ahead.
(Our Quarterly special economic report is available to clients of our managed portfolio strategies.)
The Citigroup Economic Surprise Indices are objective and quantitative measures of economic news. They are defined as weighted historical standard deviations of data surprises (actual releases vs Bloomberg survey median). A positive reading of the Economic Surprise Index suggests that economic releases have on balance beating consensus. The indices are calculated daily in a rolling three-month window. The weights of economic indicators are derived from relative high-frequency spot FX impacts of 1 standard deviation data surprises. The indices also employ a time decay function to replicate the limited memory of markets.


