Earlier in the week we discussed the divergence of the Spearman Indicator and how the indicator is used. It was also showing that there was more potential downside that could be coming as the breakdown and slope was providing downward pressure from an “overbought” condition.
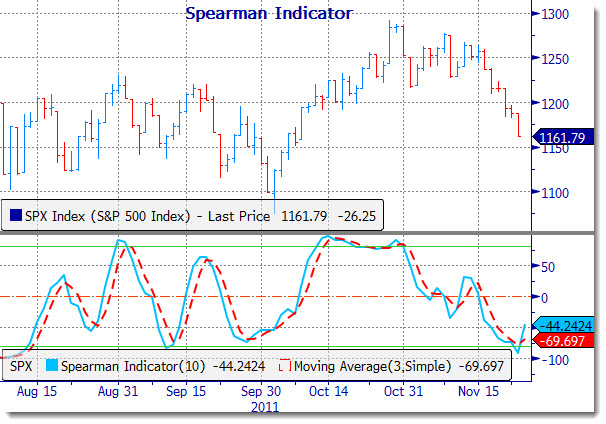
With all of the bad news out of Europe and Asia, it is hard to determine the daily, weekly or any other direction the market may take. But, if a short-term trading setup is what can be gleaned from this indicator, then there could be a buying opportunity coming. As noted in our previous update, the classic buy signal is generated when this indicator moves above the zero line from below. We are not there yet, but the sharp change of direction from the “oversold” level is interesting as the trend for the S&P 500 is still down.
Even so, there are several indications that selling pressure may be getting exhausted. This indicator is just one example that illustrates how an oscillator turning from such low levels often leads to a change in the trend from what seems to be unlikely points in time.
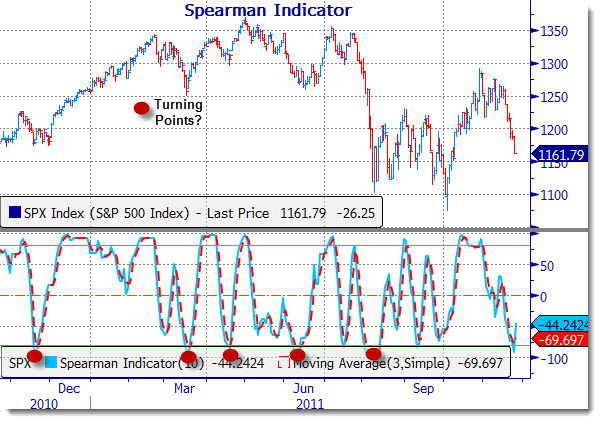
Take a look at the red circles that have been placed at times when the level of the indicator was at similar levels as was recorded on Wednesday. Just after a sharp change of direction occurred, there was a turning point for the S&P 500, even if just temporarily. The indicator has now changed direction and is climbing from an oversold level, crossing above the 3-day moving average. Again, in the past this was an indication that there was the potential for a sharp bounce for markets that could have begun within days.
Below is the same daily chart – closer up.
There are other indications that selling pressure may be close to exhaustion. As an example, the McClellan Oscillator is close to historically low levels. As Tom McClellan points out, this is a rare occurrence to see and is often a time to look for a change of trend. If that is to be the case, a long position in the S&P 500 (SPY) or even the Russell 2000 Index (IWM or TNA) may be something to consider for a short term trade.
Of course none of the indicators that simply look to price action can accurately call the precise point of entry or exit – especially when markets are so incredibly sensitive to headlines.
Now, if there is to be a directional change to be seen, there are a few key levels to consider if entering a long position. Below are the points for the S&P 500 that we would need to consider/respect:
- End of month performance chase/window dressing may occur at any time
- Wait for a break above 1,166 to initiate a long trade
- Upside breakout may be limited to 1,185 – 1,191
- The longer-term trend is DOWN
- A breakdown from current levels could hint of a decline toward 1,135
NOTE: As a matter of general strategy, we DO NOT subscribe to the theory of “overbought” or “oversold” as either conditions may continue for some time. That said, there are times that trend reversals do offer trading opportunities.
___
Looking to invest in The Disciplined Investor Managed Growth Strategy?
Click HERE for the virtual tour….
___


