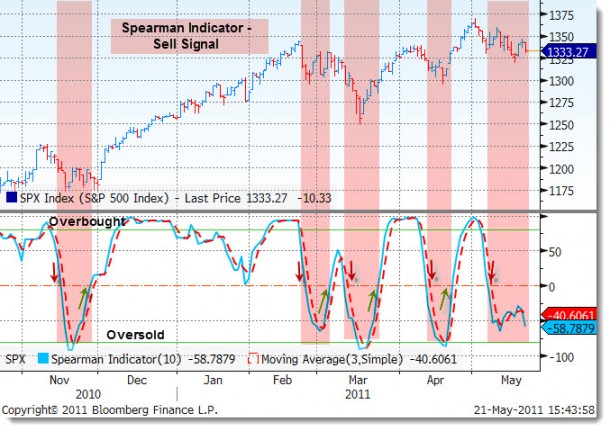
One of the newer oscillators on the Bloomberg platform, the Spearman Indicator has done a fairly good job at showing potential points to buy or sell. Here we are looking at the S&P 500 index. The chart below shows that the indicator has flashed a sell signal recently and it is moving toward an oversold level. Both oversold and overbought levels can last for a while and neither are indications of times to move in or out. But the cross above or below the zero line for this oscillator appears to provide a higher level of confidence for an entry or exit.
We just started to look at this and will follow up with more information as to the accuracy and usefulness to use as one more tool in the chartist’s toolbox.
(Click to enlarge)
According to Bloomberg:
The Spearman Indicator, also known as the Spearman Coefficient, is an oscillator designed to determine overbought and oversold conditions in the markets. Developed in the early 1900’s, the Spearman indicator is derived from an analysis of the correlation between a sorted list of prices and the original sequence of the prices. When the oscillator crosses above zero from below it may be interpreted as a buy signal; crosses from above to below zero may be interpreted as a sell signal.
This indicator was spotlighted in the Trader’s Corner column of the February 2011 edition of Technical Analysis of Stocks and Commodities magazine.


