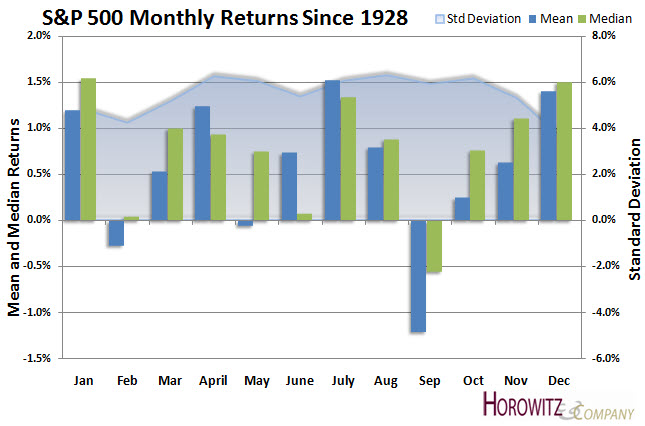
Historically, September has shaped up to be the worst month for stocks with an average rate of return from 1928 to 2009 of -1.21% and a median return of -0.56%. As seen in the chart below, there is only two other months with returns in negative territory. However, these months (February and May) don’t have as much velocity to the downside as has occurred in September.
(Click Chart to View Larger Image)
Investors may be looking for opportunities and a silver lining in September considering the -4.74% decline in the S&P 500 in the month of August. But, when figuring in the recent decline in economic data, decreased stimulus measures (housing tax credits) and staggering rate of unemployment, investors may be faced with an uphill battle against September’s history.
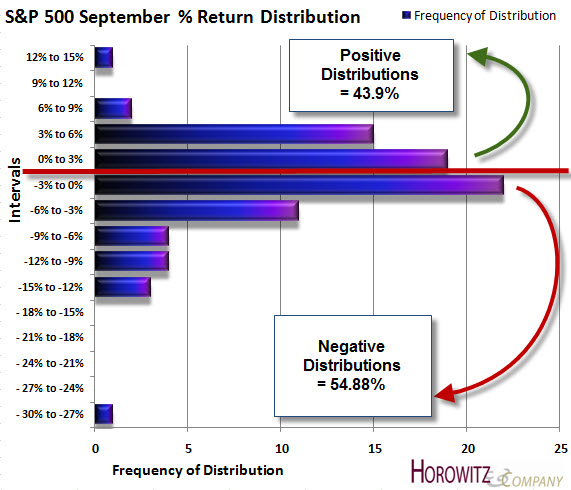
Not all Septembers have been “bad” since 1928. In fact 36 out of the 82 samplings or approximately43.9% of the time there was a positive outcome with an average value of 1.43%. The downside is that 54.88% of the time there was a negative outcome with an average drawdown of -2.63%. There was also 1 return of 0% out of the total 82 samplings.
Standard Deviation, a measure of volatility and risk has also been high, coming in 5.94% making this particular month a dangerous time to be invested.
When considering pure seasonality, November, December and January appear to be the best times to invest with low volatility and better returns.
One more thing… Now that the month close (last 3 months) for the S&P 500 is at or under the 10-month EMA and SMA, that creates additional reason for caution. Historically, that has been a rather accurate sell signal and a start off a new trend.


