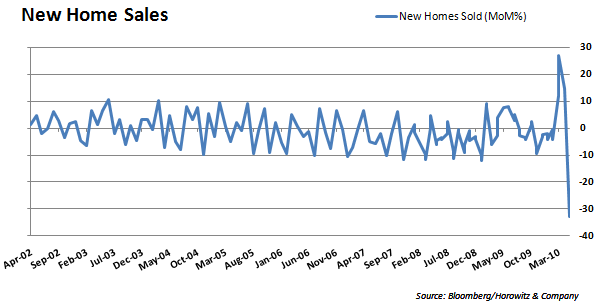
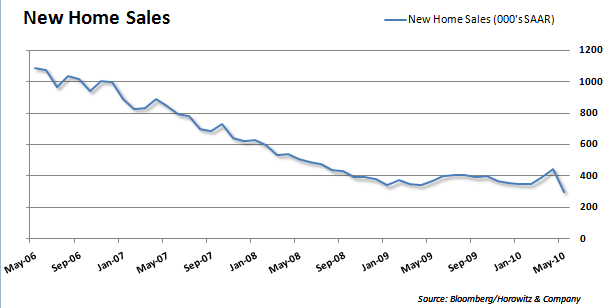
The news of the morning had to be the dreadful new housing numbers. We expected a low number after the expiration of the the special tax credit and the low existing home sales number. Add to that the low level of builder’s confidence expressed in the last survey and the results matched our expectations.
- May New Home Sales 300K vs 430K Briefing.com consensus; M/M -32.7%
The raw number appears to be a record low. That shows us a few things. First, the overhang (hangover) from the credit is similar to what we saw with the cash-for-clunkers. It also confirms that there is an excessive amount of inventory available to choose from. Since there is often the ability to better negotiate with a homeowner rather than a builder, sales of existing homes may win out.
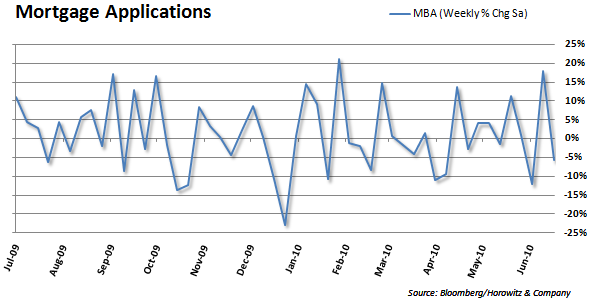
Mortgage application fell as well. This is also expected considering the high level of unemployment, lack of demand post-housing credit and tight credit conditions. Even so, while it may have been expected, it is not welcomed.
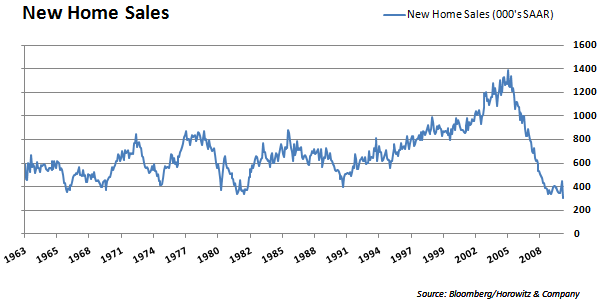
To drive this all home, below is a chart that shows just how bad this release was. It provides data going back to 1963 (the earliest date for this data) and is clearly the worst homes market ever recorded.


