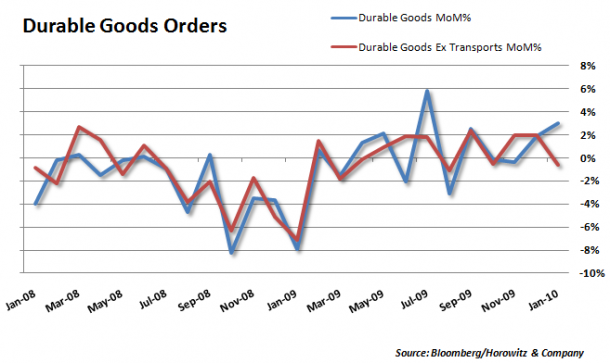
 It all depends on how you look at things. While durable goods came in much better than expected, the excluding transportation number was disappointing.
But, looking deeper at the report, there were some bright spots and far be it for us to look for a silver lining that is not actually there…
But the numbers for the transportation and defense sectors were impressive and that is probably what led to a nice rally in the materials sector on Thursday after the report was issued. Even though there was a serious sell off early in the day, the metals and materials held up nicely and then rallied all the way into the close.
Perhaps some of this is still hangover from the cash-for-clunkers and even the cash-for-appliances initiatives. Or more to the point, this is the after effects of the inventory re-stocking cycle that we have been predicting.
Here are some key points from the recent report (From the U.S. Census.org) that need to be highlighted:
- Nondefense new orders for capital goods in January increased $2.6 billion or 4.7 percent to $57.7 billion.
- Shipments for capital goods decreased $2.1 billion or 3.5 percent to $57.7 billion.
- Unfilled orders for capital goods decreased slightly to $409.0 billion.
- Inventories for capital goods increased $0.5 billion or 0.3 percent to $131.8 billion.
- Defense new orders for capital goods in January increased $1.6 billion or 19.2 percent to $9.9 billion.
- Shipments of transportation equipment, down following two consecutive monthly increases, had the largest decrease, $1.6 billion or 3.5 percent to $44.6 billion.
- New orders of transportation equipment, up four of the last five months, had the largest increase, $6.0 billion or 15.6 percent to $44.8 billion. This was led by nondefense aircraft and parts, which increased $4.0 billion.
The actual numbers:
- US Durable Goods Orders (Jan) M/M 3.0% vs. Exp. 1.5% (Prev. 0.3%, Rev. to 1.9%)
- Largest rise since July 2000
- US Durable ex. Transportation (Jan) M/M -0.6% vs. Exp. 1.0% (Prev. 0.9%, Rev. to 2.0%
- US non-def cap. ex-aircraft (Jan) M/M -2.9% vs. Exp. 0.8% (Prev. 2.2%, Rev. to 3.3%)


