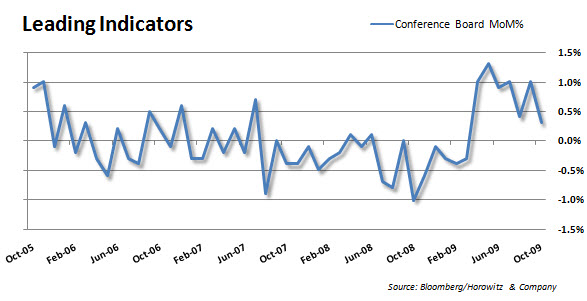
The economic numbers for the day (Thursday) were not very encouraging. Leading indicators are continuing to fall. That is an indicator that that many bulls were hanging their hats on since March. Now is is continuing to show weakness and may be pointing directly to the Double Dip we have been discussing. (Less Good)
Combining the poor showing for leading indicators and the high unemployment rate may force Obama’s hand to add a second stimulus. Of course this will be very unpopular and the Republicans will have a real field day with it showing that the Democrats have failed to follow through with their promises and then go on to shout from the rafters that Dems cannot be trusted with a health care reform plan. Politics, politics….
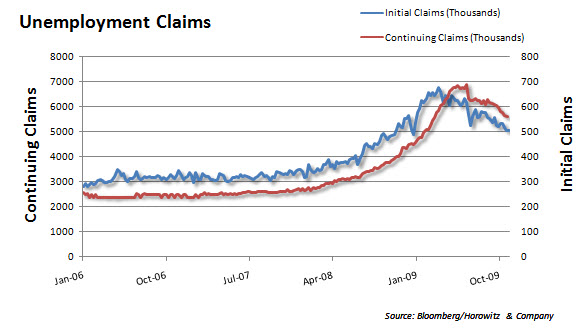
The unemployment chart shows initial claims better and the continuing claims moving lower. DO NOT be fooled though. Many unemployed have run out of benefits and we will see this number start to rise as the latest benefits extension becomes available. Yes, the good news is that initial claims are getting closer to breaking the 500k mark. That would be a welcome sign when we see it.
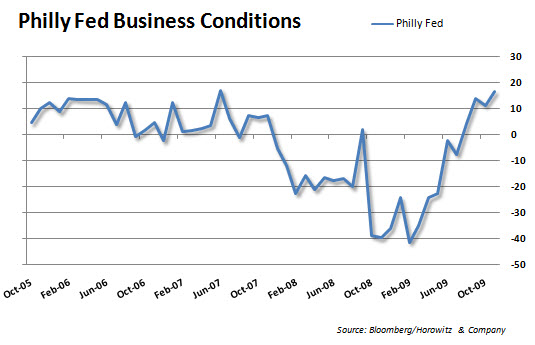
The good news of the day had to be the PhillyFed business conditions report. Economists had thought that this would ramp up to 12.2 and the actual came in at 16.7. That was a healthy increase. Nice to see…
___
Disclosure: Horowitz & Company clients may hold positions of securities mentioned as of the date published.


