We are carefully entering portfolio positions in this environment. (Note: Portfolio positions vs. trading positions) A company that we like for its specialty product is Cubist Pharmaceuticals (CBST). It has made all of our screens recently, but we were reluctant to add it to portfolios as the very recent trends have been down, down, down. The official line from the company’s description page:
Cubist Pharmaceuticals, Inc. (Cubist), is a biopharmaceutical company focused on the research, development and commercialization of pharmaceutical products that address unmet medical needs in the acute care environment. The Company’s products are used primarily in hospitals but also may be used in acute care settings including home-infusion and hospital outpatient clinics. Cubist has one marketed product, an intravenous (IV) antibiotic, CUBICIN (daptomycin for injection). CUBICIN is approved in the United States for the treatment of complicated skin and skin structure infections (cSSSI), caused by Staphylococcus aureus (S. aureus) and certain other Gram-positive bacteria, and for blood-stream infections (bacteremia), including right-sided infective endocarditis, caused by methicillin susceptible and methicillin resistant S. aureus (MSSA and MRSA).
In other words, they have a product that is used in various settings to fight a very stubborn bacteria. In a world that is becoming smaller and the reality that flu season is upon is, sales should benefit. But, the one problem is that they are somewhat of a one-trick pony. With only one major product, there is a concern that the competition could heat up and that would become problematic. Until then though, this looks like it has some potential.
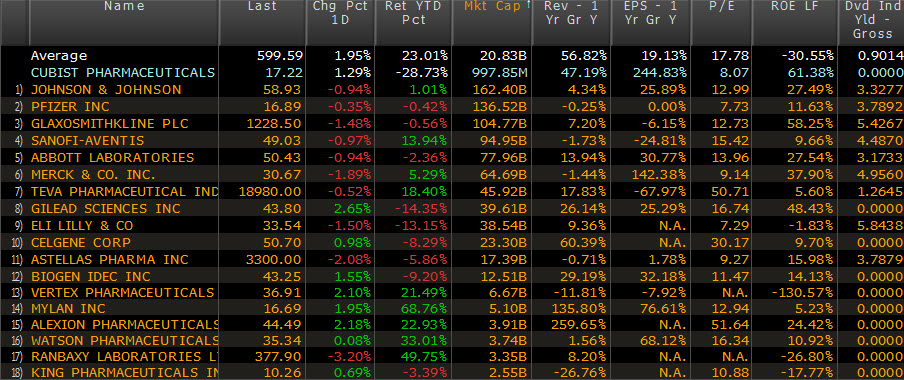
(Peer Group – Click to enlarge)
Cubist is a $1 billion market cap company with sales of $433 million. It’s P/E ratio of 8 is low for the industry and as compared to peers. Growth rate approaching Net profit margin of 17.7 (operating margin of 31%) is one of the best against competitors as well and with over $8 cash per share, it has a definite floor.
- 2008 Revenues -$433.64M
- 2007 Revenues – $294.62M
- 2006 Revenues -$194.75M
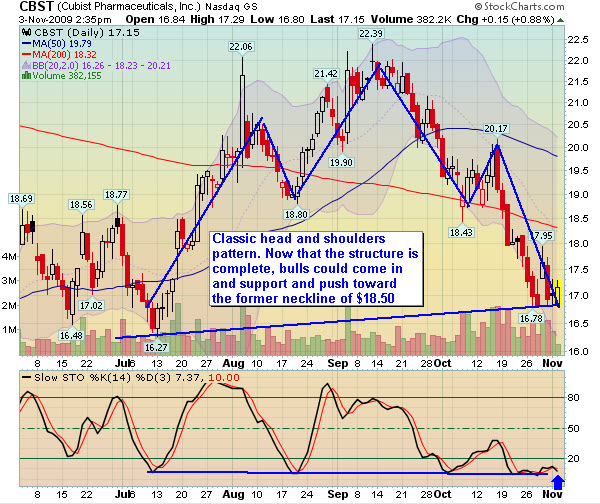
Below shows a pattern that is classical and has support at the base of the shoulders. Obviously this is also a bearish indicator from the top of the shoulder, which played out.
Disclosure: Horowitz & Company clients may hold positions of securities mentioned as of the date published.


