It all depends on how you look at it….
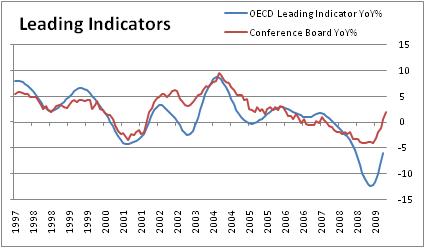
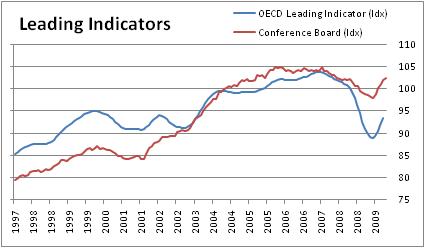
On a year over year basis, the Leading Indicators from both the Conference Board and OECD are turning up from a deep base.
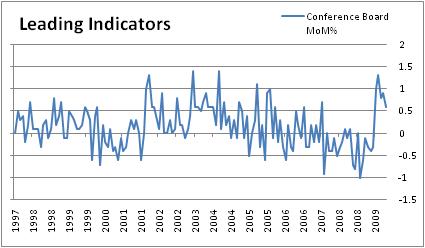
On a monthly basis though, things look a bit different.
From the component makeup, employment is the largest drag it appears.
From Dismal.com
- The Conference Board index of leading indicators rose for a fifth consecutive month, increasing 0.6% in August. July’s increase was revised to 0.9% from 0.6%.
- Seven of the survey’s 10 components were either neutral or positive, the same as in the prior four months.
- A positive interest rate yield spread, higher stock prices, and longer supplier delivery times in manufacturing were the biggest contributors in August, adding more than a full percentage point to growth.
- A decline in nondefense capital goods orders and the real money supply subtracted 0.4 of a percentage point from growth.
- The leading index in August was 1.9% higher on a year-ago basis, the highest since April 2006. The cycle trough was -3.9% in March, highlighting just how dramatic the turnaround has been.
- The three-month annualized rate dipped to 9.5% from 10.9%, while the six-month annualized rate improved to 9% from 6.2%. The last time the six-month rate was increasing this quickly was in March 2004.
- With August’s increase, the leading index has reversed 66% of its 6.2% peak-to-trough fall spanning January 2006 to March 2009.
- The coincident indicator, which consists of nonfarm payrolls, industrial production, personal income less transfer payments, and manufacturing and trade sales, was unchanged in August following a 0.1% rise in July. Before July, the coincident index had fallen for eight consecutive months.


