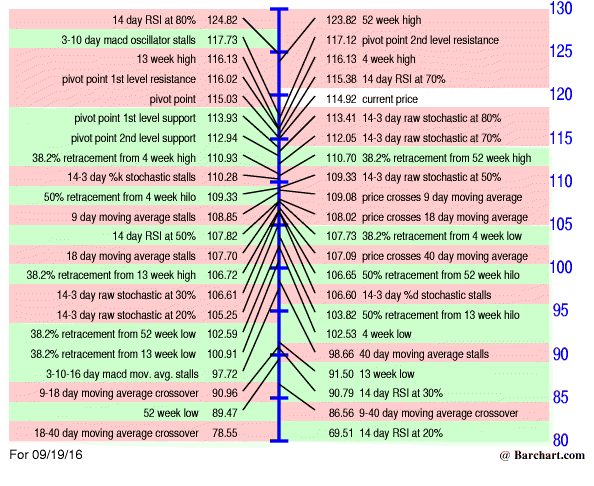
Resistance, support, moving averages and retracements are all common terms used in technical analysis. But often times, plotting all of the important points is a difficult task. That is why you should take a look at an interesting tool from BarChart.com.
It is like an all-in-one technical analysis source smartly contained in one picture. Below is an example of Apple (AAPL) with up to date info. You like?


