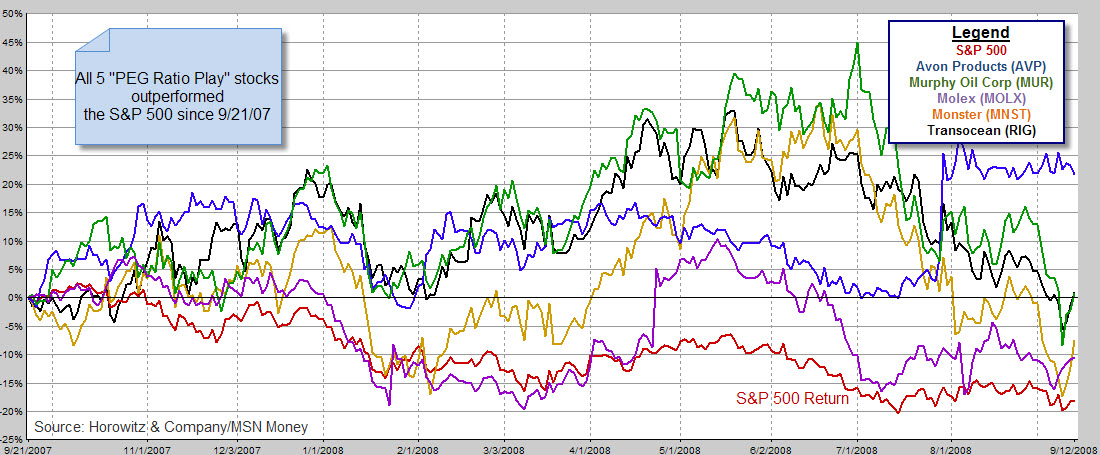
Last year, 5 positions were recommended from a screen we created to provide a simple way to seek out stocks that may be considered value investments but have superior earnings growth characteristics. The results/performance of the 5 positions with the highest EPS Growth estimated for next year.
In my book, “The Disciplined Investor,” I discussed PEG ratio as a useful tool to be put in your investment toolkit. And these days, we can all use all of the tools available.
Excerpt from “The Disciplined Investor”:
More than likely, a result that is less than one tells us that we may have a good investment that is undervalued for the time being. On the other hand, a result of more than one is usually a sign that the position is valued higher than it should be. Originally, the PEG Ratio was developed to look at stock statistics in more than one dimension. By adding expected growth to the P/E ratio, it will effectively provide a comparison tool to level the paying field when valuing stocks.
Originally, the PEG Ratio was developed to look at stock statistics in more than one dimension. By adding expected growth to the P/E ratio, it will effectively provide a comparison tool to level the paying field when valuing stocks. Small to Mid-Cap stocks are well suited to utilize the PEG Ratio as the initial screening tool since they usually pay little or no dividends. In effect, is a good tool for some stocks that are usually more difficult to value using traditional methods.
Just as it is true that the ratio is beneficial for smaller stocks, larger stocks should have an additional requirement to help create a more usable and more appropriate valuation tool. By simply adding an overlay of dividend yield along with the earnings, a much better outcome can be crafted for large-cap stocks.
Here is a quick guide to using the PEG ratio as a part of your investing; lower numbers are better:
PEG ratio guide
- 0.50 or less -> Strong buy
- 0.50 to 0.75 -> Buy
- 0.75 to 1.00 -> Hold
- 1.00 to 1.25 -> Possible sell
- 1.25 to 1.75-> Consider shorting
- Over 1.75 -> Short or sell
If you would like to find stocks with a low PEG ratio that spells profit potential, start with a screen that I developed for the MSN Money stock screener.
The criteria are as follows:
- S&P index membership = S&P 500
- PEG ratio below 1
- EPS growth next year >= Annual EPS growth rate
- Forward year P/E <= P/E ratio: current
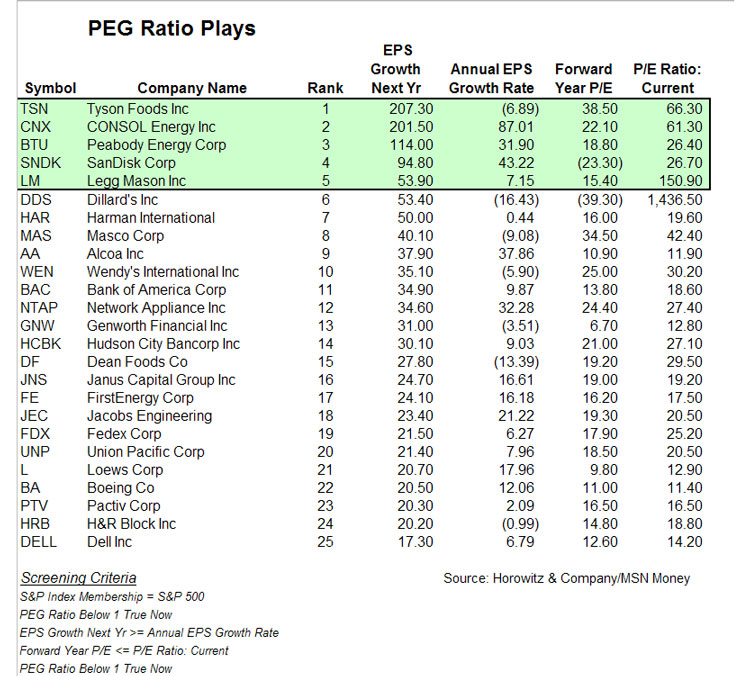
When you have the results, use the five with the highest EPS growth rate for the next year as potential positions that may be included in your portfolio. Of course, this is only one tool and these stocks are ideas for you to research further.)
A year ago, the group would have been Avon Products (AVP) Murphy Oil (MUR), Molex (MOLX) Monster (MNST) and Transocean (RIG). All five outperformed the S&P 500 during the time period from Sept. 21, 2007, through Sept. 12, 2008.
When I ran the screen again recently, the five positions with the highest estimated EPS growth for the next year are Tyson Foods (TSN) , Consol Energy (CNX), Peabody Energy (BTU) , SanDisk (SNDK) and Legg Mason (LM)
Nore: Sandisk jumped 20% since we implemented these screen results only a few days ago.


