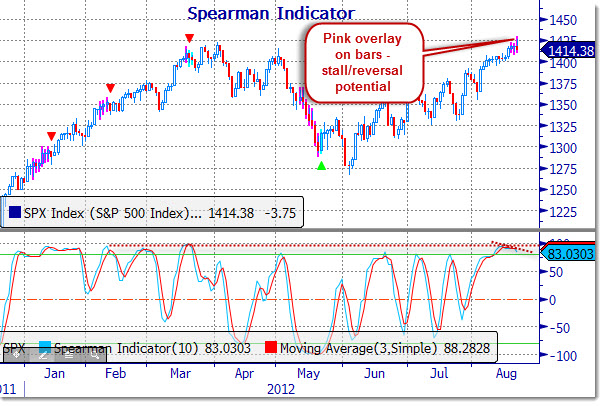
The Spearman indicator is a useful tool. In fact, we use some of the calculation/data points for our Key Reversal Indicator.
A chart that we have posted here before has been updated as we received several requests from readers.
Note that the recent reading was one of the highest seen in some time and now the indicator is starting to flash a warning signal. That, coupled with the Trend/Stall indicator is going to important to watch and see if they confirm each other.
Our good friend, Bill Sindel over at Bloomberg helped design the Trend/Stall study which is beneficial to confirm the Spearman and if there is the potential for a reversal of trend.
TrendStall identifies points at which a trend is losing momentum and is likely to stall or consolidate. The determination is based on a Rate of Change of the ADX. The parameters for the ADX, Rate of Change, and Moving Average of the Rate of Change are user adjustable.
The bar that has been determined to be the ‘Stall’ point is marked by a triangle above or below that bar. The price bars leading up to a TrendStall signal are painted a different color to alert the user that the TrendStall histogram has risen above the threshold level confirming a trend is in place and a stall is imminent. The period after the stall bar may also be painted on the price chart, depending on the value of the histogram (ADX ROC) in relation to a moving average of that value. This ‘paintbar’ period is often valuable as an indication of a slightly longer stall confirmation.


