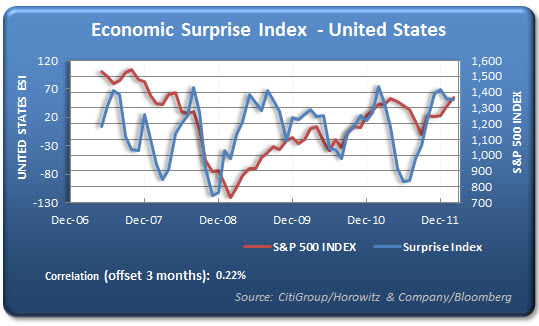
We have been tracking the Economic Surprise indicator ESI (via Citi data) and have found a loose, but worthwhile, correlation to the action of markets. As economists tend to overshoot their estimates on both sides, this helps to put the overall results into proper perspective.
The latest readings show that estimates are too high and negative surprises are starting to show through.
We have plotted the ESI index along with the S&P 500 to see if there is a relationship. Notice that once the ESI rolls down (or up) the S&P 500 usually ends up following with a slight lag.
The data is updated through 2/29/12. We have seen more negative surprises than positives through March, so the path may be continuing down for the ESI.


