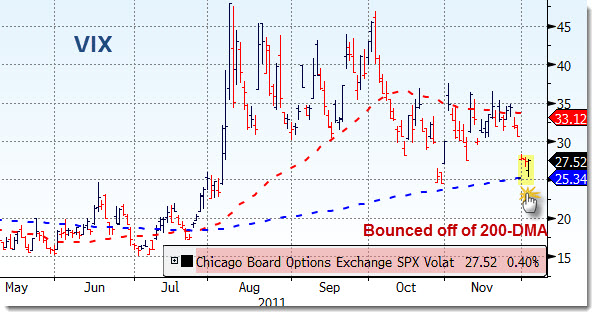
Volatility has not been absent over the past couple of years. More recently, it seems like the daily range has widened, especially if we consider the overnight future’s session.
For its part, the VIX can be used as one tool to get a read on how traders see the short term potential move for markets. While it is not a precise measure, it certainly can be a way to either hedge a long portfolio or profit from changes in sentiment. Now that the bulls and bears come out to play on a daily rotation, the excess level of risk has been built right into the VIX price.
Take a look at where the current level is as compared to the 200 DMA. Starting in July, the VIX spiked as the European Crisis intensified and markets began to drop. Before that, there was a relatively tight distance that the VIX would stray from the 200 DMA…a little above, a little below.
Last week’s rally took the price down by20% and was as much as 27% off before there was a trend-down day on Friday, in which the VIX closed at its high.
Can the VIX predict? Not really, but it can be used well to “trade” the daily love/hate for equities. Take a look at options or ETF alternatives as this can provide opportunities without specific sector risk as the global credit crisis continues to unfold.


