For the past month or so, there has been a decidedly bearish trend for silver. Not only did the CME jump-start the process when they raised the margin and initial balance requirements last month, but even with the recent weakness in the U.S. dollar, silver isn‘t being bought with any conviction.
Of course this is all about trading the position and may not apply for longer time frame if you are willing to buy and hold for a months or years, for example.
Before studying the charts below, it is important to note that over the weekend,
Mark Arbeter of Standard & Poors was out with some analysis and comments about gold and silver.
“While we think gold has an outside chance to make new highs, we believe prices could fall to the $1,250 to $1,300/oz. region in the months ahead. Silver is in much worse shape, by our analysis, and is breaking down out of a bearish wedge. We think silver could fall all the way to the $20/oz. area before this correction is finished.”
(Simple math: $20 for silver is a 45% drop from here. Keep that in mind when looking at the chart setups below)
Credit Agricole was also sharing their bearish view:
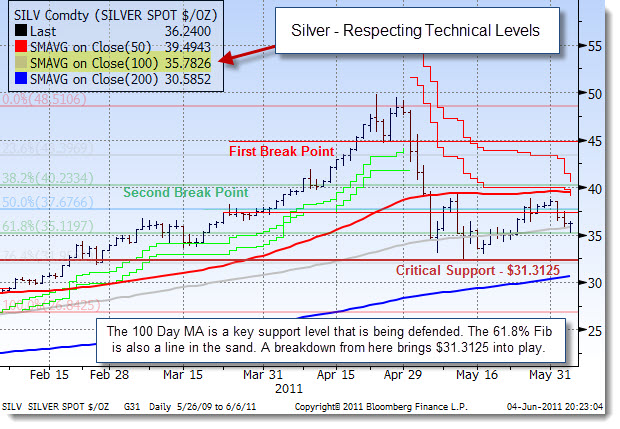
Meanwhile, silver has pulled back in line with weaker industrial metals, with prices hovering around key support located at the 100-day moving average at $35.73, the bank says. “A move below this key level could prompt further liquidation and selling, which could see the market trading at the recent lows at $32/oz, but technically is still within a correction.”
CommerzBank recently provided an update and outlook:
“…the potential right now is that we see one step forward and two steps back in silver and I think it can continue,” said Commerzbank analyst Eugen Weinberg. “The real problem is the price increase before was overdone and the market was overheated… speculative investors have not yet exited (their positions),” he said, adding: “This is a situation where the tail is wagging the dog.”
McCllean’s Chart in Focus this week summed it up:
…Looking ahead, if the current silver market keeps following the pattern made by silver prices in 1980, then we should look for a resumption of the decline starting in late June.
International Business Times had some Fibonacci levels to watch:
Once more, silver touched 38.2% seen on the image around 38.90 and couldn’t breach it. Bearish signs started to appear on momentum indicators which may bring more bearish pressure. Hence, the suggested Elliott count which has two probabilities for the wave from bottom of $32.30 reinforces the bearish direction. The general trend over short term basis is to the downside,targeting $26.65 as far as areas of 48.50 remain intact with weekly closing.
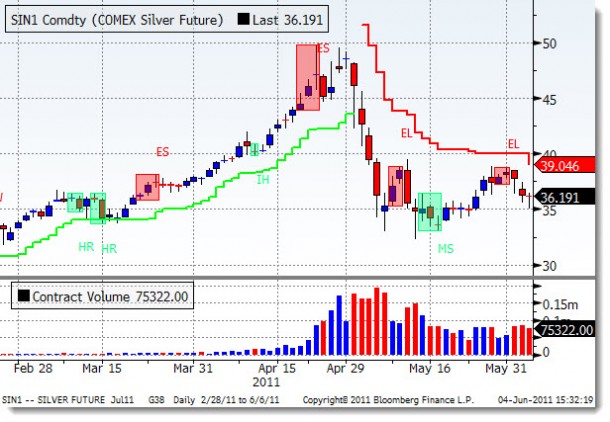
The chart below shows a different set of indicators than we have used in our previous analyses. This time, Japanese candlesticks were added to a daily chart. Of late, these have been an accurate predictor of the future direction for this commodity. In addition, the trend study (think of a parabolic study) accurately provided an alert of when the time was to get out for longs and is nowhere close to indicating moving back into a long position.
(Click to Enlarge)
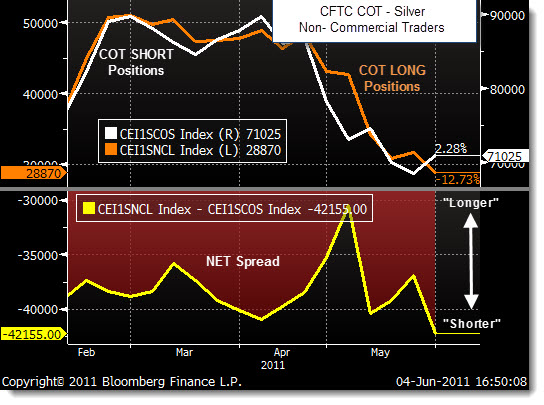
How about the positioning and outlook of the non-commercial “pro” investors? The Commitment of Traders report from this week shows that there has been a continuation of long positions unwinding. At the same time, there has been a similar/equal covering of short positions. What that means is that on the way down, while the long holders have been selling in order to lock in “any” profits they may have, shorts have been covering. There was also a significant increase in the short holdings reported (and decrease of the net spread) this week.
The spread of shorts-to-longs has been increasing and now is at it highest point since the price top in April. Shorts are starting to gather conviction as silver has been unable rally and hold for more than a couple of days. That should put additional pressure on the price as long holders are still reducing positions.
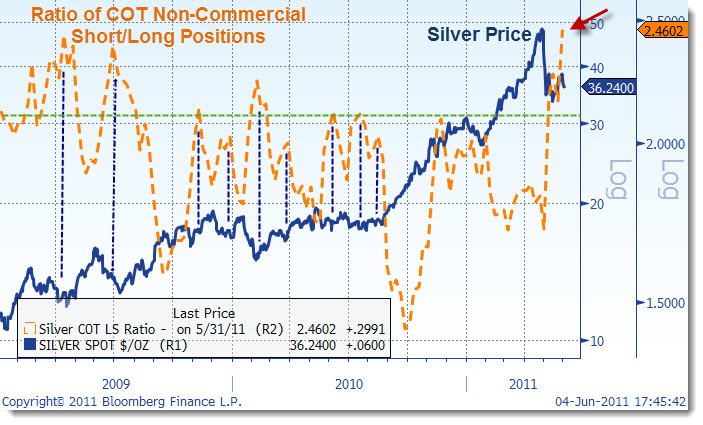
There is one word of warning that should be mentioned here: We constructed a ratio of Short/Long holdings from the Commitment of Traders Report which shows that the ratio is getting a bit crowded on the short side. Historically, these kinds of spikes have been associated with key tops and bottoms. The chart below shows a history of the ratio of net short positions to longs, overlaid with the price of silver. As the orange line moves higher, the short ratio is increasing and visa-versa.
(Click to Enlarge)
Right now there is an unusually high ratio of short interest. That may be a signal worth noting. Add to that the technical backdrop as the 100 DMA has been solidly defended and there is a potential short squeeze which may imminent. Even if that does occur, it may be considered a rally worth fading.
Strategy: If there is a quick rally off of the 100 DMA, watch for overhead resistance at the next Fibonacci level of $37.67. A break above that will bring the 50 DMA into play at $39.43.
At that point, the best entry will be to consider initiating a long position on a clean move (and hold) above $40.25.
Until that level is breached, rallies are meant for adding/initiating short positions.
——–
Key to Chart Candle Patterns: (On Chart, Green is Bullish, Red is Bearish)
HR – Harami: The dominant force is losing power and potentially changing to the opposite direction.
ES – Evening Star: Uptrend was dominant force, enticing prices to gap higher. However, the following small session symbolizes a potential change in sentiment. In astrology the Evening star planet “Venus” appears before night. Ultimately, the third session confirms and pushes lower.
MS – Morning Star: Downtrend was dominant force, enticing prices to gap lower. However, the following small session symbolizes a potential change in sentiment. In astrology the Morning star planet “Mercury” appears before sunrise”. Ultimately, the third session confirms and pushes higher.
EL – Engulfing : The engulfing indicates a transition of power between buyers and sellers, with the winner “arresting” control.
IH – Inverted Hammer: Price is “hammering out” a level and a lack of selling at the bottom. Indicative of downside rejection of a price level.
—


