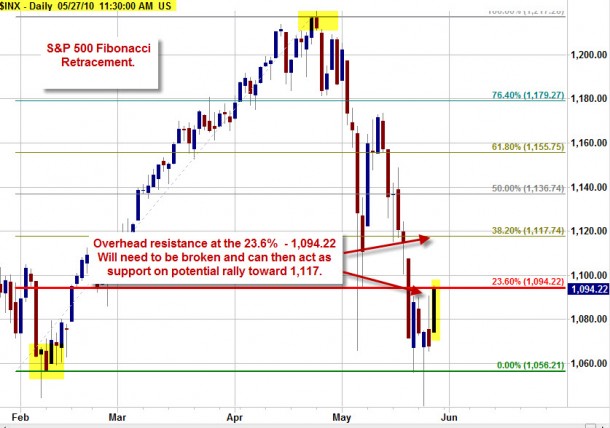
Whether or not you think that it is Voodoo or just some lines drawn randomly on a chart, there is a good deal of respect for support and resistance points. Fibonacci retracement levels produces some very important points to consider as these are watched closely by traders.
Notice that today the S&P 500 was stopped dead in its tracks, right on the 23.60% level. The low and high closed were used as the Zero and 100% levels to consider.
If we can see a break above 1094/1095, then this can act as the next level of support if the trend is higher. Otherwise, this should be looked as simply an overhead resistance point in a sideways trend between 1,056 and 1,094.
(Click Chart to Enlarge)
(Charts from Tradestation)


