

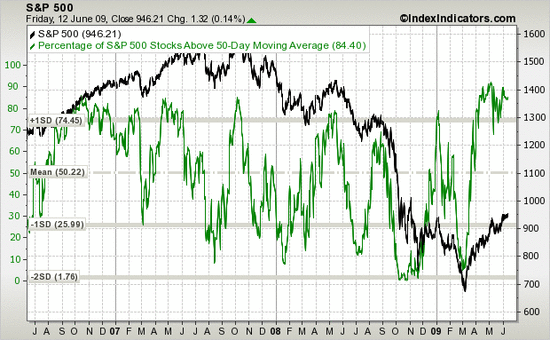
There are several technical indicators that have flashing some very concerning signs. One in particular is the number/percent of stocks in the S&P 500 and NASDAQ 100 that are above their mid- and longer-term moving averages.
Clearly this rally has gone a long way to prove that there is more than just a run of the mill short covering rally underlying the move; but traders still pay close attention when overbought signals appear.
The question now to ask is how long will the correction last (if it is more than a one day wonder) and is there something lurking that could completely derail the uptrend. Consider the following:
- Global markets are falling in unison. This could create another cascade as we saw earlier in the year
- Economic news is coming in much weaker than was expected
- Bonds and currency fluctuations are showing extreme volatility, showing that investors are not willing to be patient
- Political tensions are rising – North Korea, Middle East, BRIC Nations
- Investors want evidence of a recovery – hope is no longer good enough to raise markets
- U.S. government intervention and reckless spending is spooking global trading partners
- 9.4% U.S. unemployment – enough said on that
- Talk of exit strategies is causing stimulus addicted nations to fear the “other side”
- Low volume for NYSE/NASDAQ over past weeks show that investors are no waiting for the next move.
- Uncertainty regarding Obama Health care initiatives
- Inflation fears rising due to massive commodity retracement
- S&P approaching 20-day moving average – SMA 923.19 , EMA 924. 49 (closed Monday at 923.72)
- NASDAQ approaching 20-day moving averages – SMA 1793.68 EMA 1802.29 (closed Monday at 1816.38)
- S&P/NASDAQ Declining 200-day moving averages
- A series of low volume rallies with high volume sell-offs
- Mortgage rate increasing to 5+ month high
- Foreclosures, delinquencies and bankruptcies rising
- Extreme flow of secondary issuance which will cause earnings dilution next quarter
- Highest volatility stocks leading way throughout rally
- Most technical indicators (Stochastics, McClellan Oscillator, MACD etc) showing overbought condition for major indicies
Now is the time to take a short pause, look at what is occurring before making any substantial commitments. Broad based hedging with inverse ETFs to manage individual long positions may be a an idea worth pursuing as well.
While there are signs that a recovery may take hold at the end of 2009, there are others that appear to be providing evidence that 2010 is the earliest that the economy will stabilize.


