We have been working on both back-testing and the potential for the Market Trend Indicator as well as the Key Reversal Indicator for a while now. We want to make sure that it is solid not only from a historical perspective; but indicators that are reliable moving forward.
What you are seeing below is the output from a complex set of calculations that take into consideration several measures that have been provide insight into when a market is overheating and when it is oversold. For now, we are using the S&P 500 as the base index and will eventually expand to a customized index that will include the Russell 2000 as well.
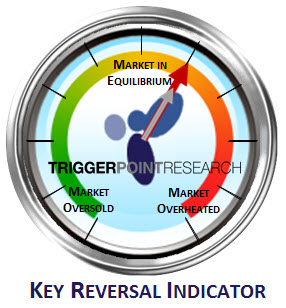
The KRI gauge provides a reference of the current position (red arrow) and the day before (grey).
The temperature of the market (trend) is shown below. It graphically shows a longer-term view of how markets/investors have been behaving. This measure includes a range of instruments along with the range of trading and the directional strength.
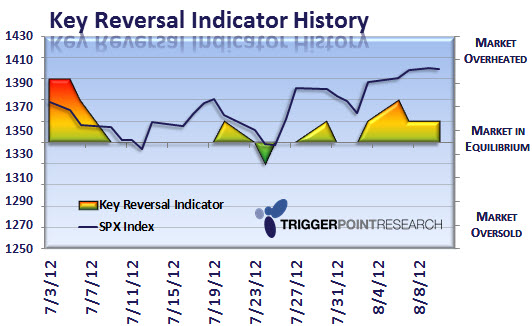
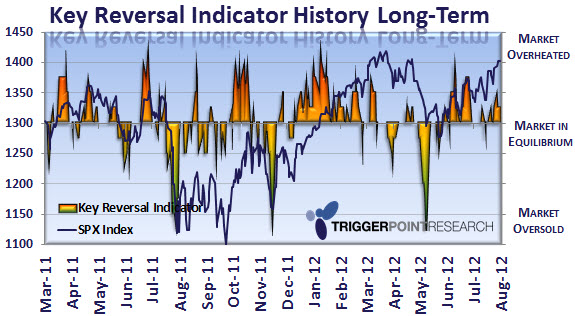
To get a feel for the history, we are charting the KR Indicator (KRI) to view how accurate (or not) it has been at predicting potential turns on a short-term and longer-term basis. Often times, the reversal will occur when there is a spike in the KRI (see lower chart for examples).
Right now, as market have been moving somewhat “smoothly” regarding the up/down action, there does not appear to be a massive warning flag that is appearing. However, markets are not in “equilibrium” as seen below and in the gauge above – indicating that a draw-down is nearing. If our indicators are working properly, we would expect that some digestion/consolidation of the recent gains will be seen shortly.
If not, then the KRI will rise and show a greater likelihood of a reversal of an overheating condition.


