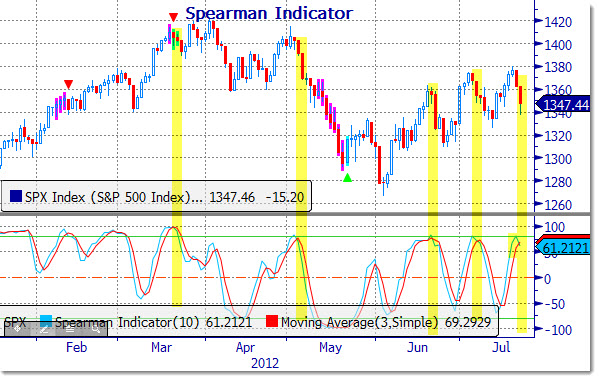
 The trusty Spearman indicator is showing an overbought condition that is now correcting. Looking at the chart, notice the highlighted areas.
Often times when the Spearman Indicator begins to roll under the moving average from above the overbought level, there is a correction. While the indicator cannot provide the magnitude or duration, notice that once the trend changes, it usually takes some time to run its course.
As of this afternoon, the indicator has crossed under in a pattern we have seen before recently.
Earlier today, we looked at some important support levels for the S&P 500 as well.


