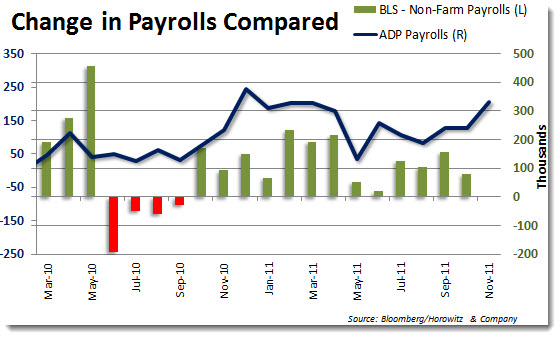
Over the past two years or so, the ADP payroll number, released two days before the NFP employment report, has been used as a guide for what may be revealed in Friday’s NFP report. The most recent ADP surprise of +206 additions has many looking for a much better NFP number than had been estimated just a week ago.
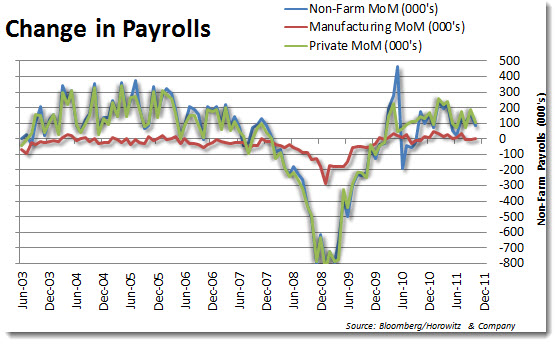
Comparing the history of the ADP report to the NFP shows that since 2003, the average difference between the two has been only 1,600. Not bad. Of course there are those times that there is a big spread, but over the longer run, the two have shown a high level of correlation. Overall, since 2003, the difference in the two is +170,000 that ADP has reported above the NFP report. That too is well within tolerance.

The ADP National Employment Report is a measure of nonfarm private employment, based on a subset of aggregated and anonymous payroll data, using approximately 365,000 of ADP’s 500,000 U.S. business clients and approximately 24 million employees working in all 19 of the major North American Industrial Classification (NAICS) private industrial sectors. The ADP National Employment Report was developed to help meet the need for additional timely and accurate estimates of short-term movements in the national labor market among economists, financial professionals, and government policy-makers. — This series began in May 2006, and historical data was made available back til Dec. 2000.
The big surprise was that analysts were looking for +130k additions to the ADP report and the actual number came in at +206k.
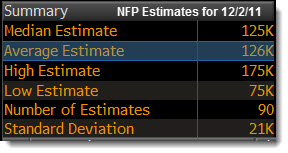
Over the last month, the average estimate for NFP payrolls added has moved up from +90k to +125.
The highest estimate of +175k is shared by Carey/Harajli of Credit Agricole CIB and Colm Fitzgerald of Paragon Research. Credit Agricole recently increased their estimate by +70k.
The “belly” of the distribution of estimates is right at +130k. That is where we believe will be seen as the difference between a beat or a miss.
Make no mistake, there is a good deal of optimism going into this report. Anything under +100k will be seen a big disappointment, but not so bad that the FED needs to act. Markets have already priced in the higher estimates and while lately there have been many U.S. economic indicators that have been a positive surprise, markets take this one as one of the most noteworthy.
Frankly, one of the reasons why this is not as important to us is that we still believe that high unemployment has been a gift to the stock market. Even though there is nothing good to say about people out of work, the fact is that lower labor costs mixed with higher technology utilization has helped to keep companies mean, lean and profitable.
Another reason for optimism going into this report is that labor costs have been coming down dramatically. It is possible that there is a move to hiring as costs are lower than they have been for a while. Of course that also depends on how much demand there is for additional employees at a time when there is a global slowdown occurring. 
The bottom line is this: Markets will see the report as a negative if the number comes in between +75k and +100k. That will spook those investors that moved all-in on the news this week of the coordinated effort of central banks around the world stepping in to save the Eurozone. Below +50k may be reason to bring up the topic of QE3 or other stimulus, thereby muting the potential for a big drop in equities.
If we see that +150k or more were added, that too could be somewhat problematic as the U.S. dollar may rise as it is seen as a good bet as compared to other currencies. That may also signal that another round of stimulus could be put off.
Therefore, the sweet spot is a range of +101k to +140k.
One more note: Manufacturing additions will be watched closely as these have been under pressure for some time. Anything that is positive on this portion of the report should be taken well. Plan accordingly…

___
Looking to invest in The Disciplined Investor Managed Growth Strategy? Click HERE for the virtual tour….
___


