During the month of September, we are going to be adding a special section to this site.
The TDI Managed Growth Strategy provides a private “client-only” blog where we discuss the day and our general outlook. Areas that we cover range from current holdings analysis, economic reports, political commentary and more.
The primary purpose of the “client-only” blog is provide information so that clients for whom we manage money will have a better understanding of what is the rationale for portfolio decisions. In addition, the information is designed to be educational so that readers can learn from both our mistakes and successes.
On a daily basis, simply follow www.thedisciplinedinvestor.com or use an RSS reader and point it to : http://tinyurl.com/3u3jahy or http://www.thedisciplinedinvestor.com/blog/category/stocks/insideedition/feed/
2011-09-22
The kitchen is way too hot! Or better said, the markets are too erratic to provide any degree of comfort that there will be a reasonable outcome for positions held. Even the “best” stocks get clobbered during market downturns – and this is official a downtrend/correction. Now that the NYSE is down more than 20% from its recent high and the DJIA has undercut its intraday low of 2011, a flag of extreme caution needs to be raised.

Over the past two days, our Market Trend Indicator (mti) has slipped two notches and now is flashing a confirmed downtrend that has us looking for shorter-term trading opportunities, rather than core long positions. This will change once (if) we get up to the next level (Level 1). For now, the best use of money is to be ready for opportunities as they become available.
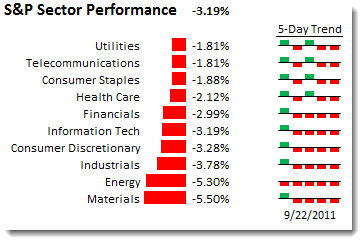
Looking back on the reasons for the massive sell off on Thursday, we can easily pin it on the following:
- Follow through selling that started at 3pm after the FED statement
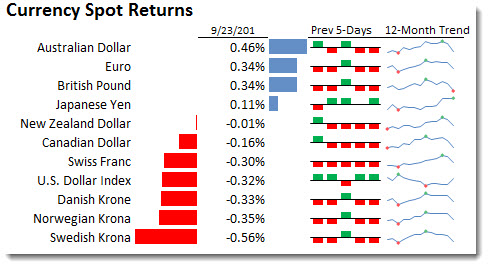
- A rising U.S. Dollar
- China’s Flash PMI at contraction levels
- Wild Currency swings (Brazil’s Real moved 5%)
- Poor manufacturing reports from Europe
- Technical Breakdowns
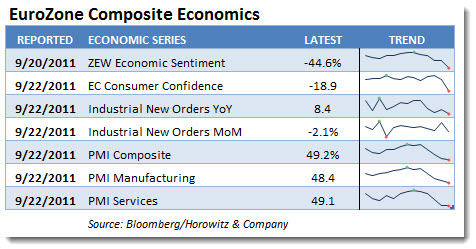
As for the European economics that really unleashed the selling frenzy:
Most of the indicators came in BELOW expectations and with readings that are considered recessionary levels. The charts to the right of each indicator show that the manufacturing reports came in at the lowest point in a year. This ties out with Trichet’s recent assessment when he saw significant risk to future growth. That was apparently the same comment that the FED made yesterday and has many thinking that the U.S. is also headed down the same path.
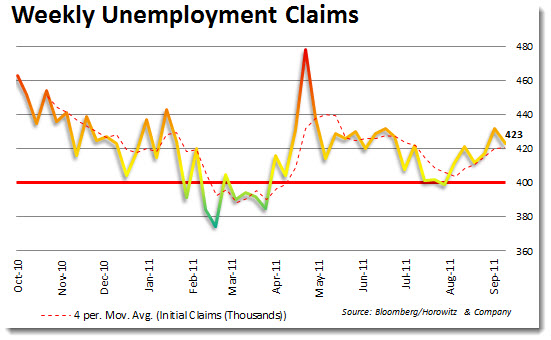
So, the question that needs to be asked is whether or not we are in a recession or not. For what it is worth, we believe that if the U.S. is not in a technical recession as of September 2011, the economy is experiencing recession-like qualities. The slow (pathetic) GDP growth, slowing wages, high unemployment and stagnating manufacturing are all the hallmarks of an impending recession. Top it off with the global stock market rout and the evidence is piling up.
Here is something that I saw today that was what we have been thinking about for a while. It is amazing the frequency of these late-session “positive” headlines. They always seem to come about an hour or so ahead of the U.S. equity close. Most agree that it is always good for a quick bounce, but the record is very mixed in terms of igniting a sustainable move.
Today’s 3pm headline (or better said; HeadLIE ) was that Europe was set to accelerate their plan to recapitalize 16 banks. This ignited Euro for a short- time. Concurrently, short covering ensued and that was enough to push up the S&P 500 up by 10 points in minutes. Could it be that it was an unbelievable coincidence that it was just as the markets appeared to be on the verge of a breakdown that these appear?
We had been looking to trade short the break below 1,120. Each time (twice) we added the short position, there was a rumor driven bounce that took us out. There is obviously a bit of desperation cycling in these markets.
___
Looking to invest in The Disciplined Investor Managed Growth Strategy? Click HERE for the virtual tour….
___
WAIT! Well Well Well, it is 3:40pm and the next headline is out after the markets just hit a new intra-day low at 3:20pm.
Again, as our Market Trend Indicator is now firmly showing a downtrend condition, we sold all of of the individual stock holdings as they breached our support levels and are left with a 10% position in the Russell2000 Index ETF, 5% SPDR Utilities ETF and 5% Peru Market ETF. A Call option on Silver (SLV) was added at near the close as there was supportive buying at the that we have been tracking. (October $37 Call)
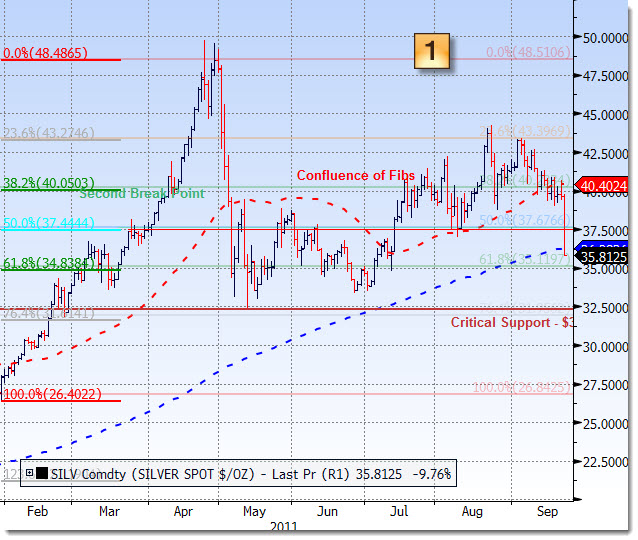
Below are the levels that have been working well for Silver.
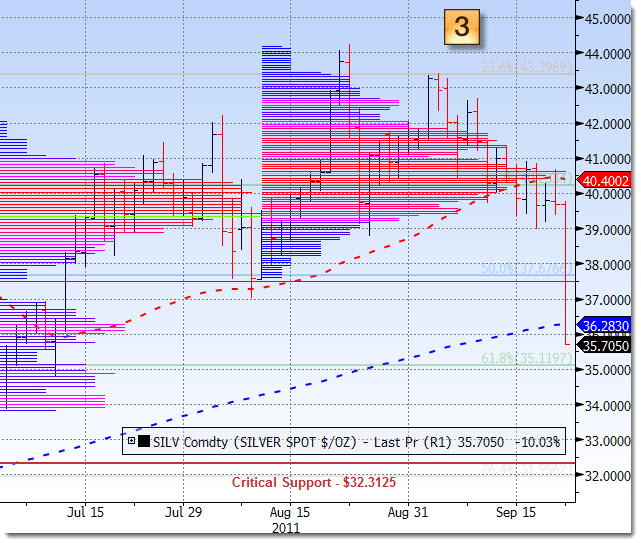
Chart 1 shows the two layers of Fibonacci Retracements that are providing a high confidence level for trade setups. The most significant resistance at the 23.6% level ($43.39) was the one we originally looked to watch in order to initiated a short position this month. We traded in and out until we saw the clear break and then added to the 2X Inverse Silver ETF. There was also evidence that the previous run-up into this range occurred on below average volume, potentially making this a place that would cause a quick turn lower if not surpassed (Chart 3)
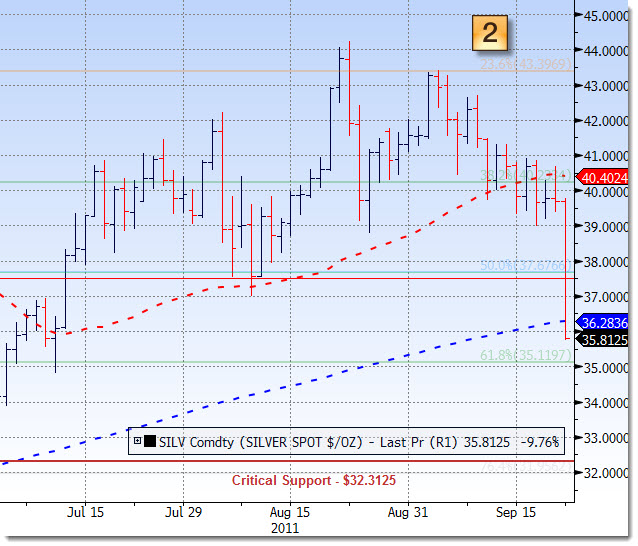
The next level of importance was the 38.2% plot (~$40). This was the key to the puzzle. Dropping below this would signify a break of the 50 DMA, a confluence of support by Fibonacci level and a historical reference to previous areas that could not hold support (Chart 2). Notice that once the break started ( helped by a global de-leveraging and the strength of the USD, the lack of volume created a gap plunge.
Chart 3 shows the market maps of volume and price, confirming that a break of the 50 DMA could cause a meltdown.
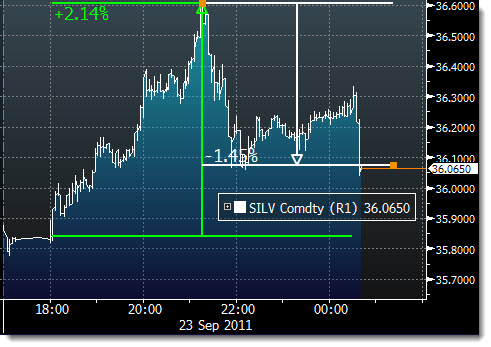
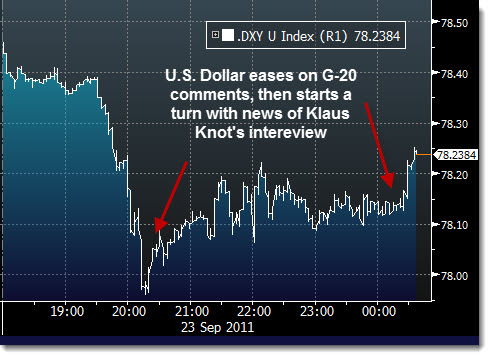
Now that the price has been supported at the 200 DMA, we have reversed part of the trade to look for a bounce. Overnight the news of a coordinated G-20 initiative to support global economies (and markets) has helped to ease some of the upward move on the USD and support the Euro. Both are keys to the movement of Silver and Gold.
Silver is following (inversely) the USD and the Euro…
After the uplifting conviction by the G-20, there was another “on the other hand” moment early Friday.
European Central Bank Governing Council member Klaas Knot sees Greek default as “one of the scenarios”, according to English transcript of an interview provided by Dutch financial daily Het Financieele Dagblad.
- “I‘ve long been convinced that bankruptcy is not necessary”
- Greek developments are “not encouraging”
- “Now less definite in excluding a default bankruptcy than I was a few months ago”
- Knot says wondering “whether the Greeks realize how serious the situation is”
- “There is doubt about the quality of the public sector and if the politicians have enough grip on the country”
 No kidding. Europe is not out of the woods yet. Even as the G-20 provides a safety net, investors are in the show-me, not tell-me mode.
The Bear Flag that we had mentioned yesterday is confirming with the move of the S&P 500. Over the weekend, we will explore this in greater detail and provide a price target based on the pattern. Also over the weekend there will be an update on the risk levels associated with the EuroZone Crisis along with the near-term outlook and our planned strategy.
If there was anything good to say about the potential action for the day it would be that there are no economic reports that will be released. At least that relieves one overhang and could provide a quick bounce for markets, assuming that no other monsters come out from under the bed.


