During the month of September, we are going to be adding a special section to this site.
The TDI Managed Growth Strategy provides a private “client-only” blog where we discuss the day and our general outlook. Areas that we cover range from current holdings analysis, economic reports, political commentary and more.
The primary purpose of the “client-only” blog is provide information so that clients for whom we manage money will have a better understanding of what is the rationale for portfolio decisions. In addition, the information is designed to be educational so that readers can learn from both our mistakes and successes.
On a daily basis, simply follow www.thedisciplinedinvestor.com or use an RSS reader and point it to : http://tinyurl.com/3u3jahy or http://www.thedisciplinedinvestor.com/blog/category/stocks/insideedition/feed/
2011-09-22
Wednesday was going to be all about the FED. We had been preparing for some form of Twisting action as discussed yesterday.
In the morning, there was some positive news in the existing housing report release, at least from the headline view. A 7.7% increase in homes sold over the month and on pace for 5 million sales on an annualized basis. Inventory of existing homes for sale also dropped and the time it would take to sell the inventory dropped to 8.5 months from 9.5 months since the last report in July.
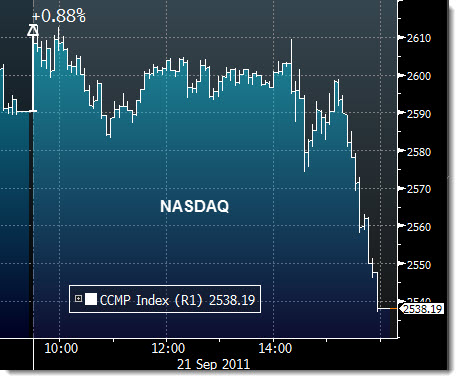
Not bad, so it seemed. With the better than expected earnings report from Oracle and Adobe, the NASDAQ was up and this report pushed it up toward the day’s high of 0.9%.
But beneath the surface of the headline there was some other points that were not as encouraging. For one, the median price of a previously owned home dropped 5.1 percent to $168,300 from $177,300 in August 2010. Distressed sales, comprised of foreclosures and short sales, in which the lender agrees to a transaction for less than the balance of the mortgage, accounted for 31 percent of the total in August, up from 29 percent in the prior month. Contract cancellations were reported by 18 percent August, up from 16 percent a month earlier. Soon after the details of the report were digested, markets began to give back some of their gains.
___
Looking to invest in The Disciplined Investor Managed Growth Strategy?
Click HERE for the virtual tour….
___
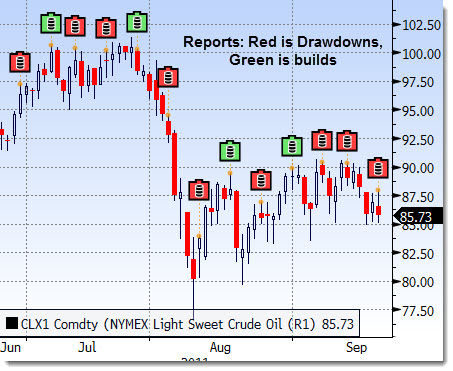
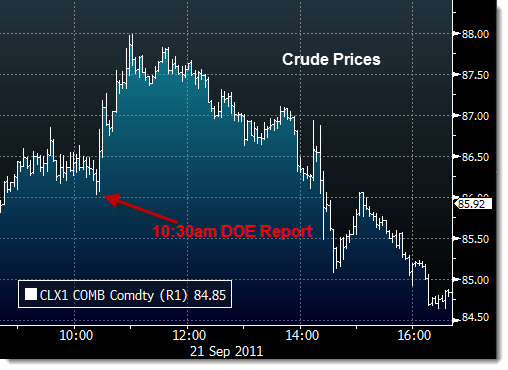
At 10:30am, we saw a rather bullish report from the DOE on oil inventories. Oil prices has been trying to climb recently against a backdrop of economic contraction. The last few DOE reports have been bullish and traders have been keen on this even as the U.S. dollar has been rising.
Below is a daily chart of the price per barrel of NYMEX crude and shown are the days with inventory reports.
Briefing.com does a great job of providing intelligent insight into the commodity markets. Here is their summary of Summary of Weekly Petroleum Data for the week ending Sept 16:
Production: U.S. crude oil refinery inputs averaged 15.3 million barrels per day during the week ending September 16, 283 thousand barrels per day above the previous week’s average. Refineries operated at 88.3 percent of their operable capacity last week. Gasoline production decreased last week, averaging nearly 9.1 million barrels per day. Distillate fuel production decreased slightly last week, averaging just under 4.5 million barrels per day.
Imports: U.S. crude oil imports averaged about 8.4 million barrels per day last week, down by 191 thousand barrels per day from the previous week. Over the last four weeks, crude oil imports have averaged about 8.8 million barrels per day, 469 thousand barrels per day below the same four-week period last year. Total motor gasoline imports (including both finished gasoline and gasoline blending components) last week averaged 692 thousand barrels per day. Distillate fuel imports averaged 158 thousand barrels per day last week.
Inventory: At 339.0 million barrels, U.S. crude oil inventories are in the upper limit of the average range for this time of year. Total motor gasoline inventories increased by 3.3 million barrels last week and are above the upper limit of the average range. Finished gasoline inventories decreased while blending components inventories increased last week. Distillate fuel inventories decreased by 0.9 million barrels last week and are in the upper limit of the average range for this time of year. Propane/propylene inventories increased by 0.6 million barrels last week and are below the lower limit of the average range. Total commercial petroleum inventories decreased by 5.3 million barrels last week.
Demand: Over the last four weeks, motor gasoline product supplied has averaged just under 9.0 million barrels per day, down by 1.7 percent from the same period last year. Distillate fuel product supplied has averaged nearly 3.9 million barrels per day over the last four weeks, up by 0.5 percent from the same period last year.
Finished Motor Gasoline (Implied Demand): Finished motor gasoline demand for the week ended 9/16 was 8,858K bpd, slightly higher from last week’s 8,848K, and modestly higher from the yr ago period of 8,847K
Oil moved higher right after the report as the draw down in crude inventories was much greater than expected. But, by noon the price began to swoon.
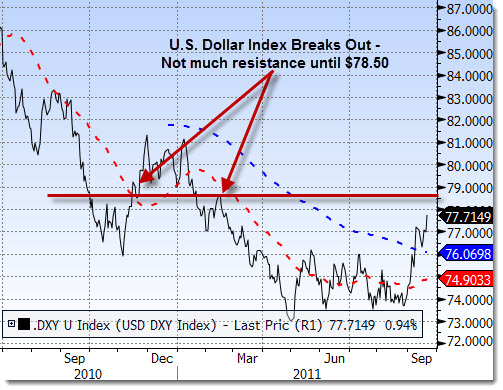
Part of the problem was that markets were weakening in general and there was a concern about the upcoming FED statement at 2:15pm. The U.S. Dollar had been somewhat weak throughout the morning, even though the general trend has been higher. Now above the 50- and 200-DMA, there is limited resistance until $78.50 or so.
As commodity prices are inversely correlated to the USD, the higher levels for the USD have not been supportive of commodity pricing.
Up until the FED statement, the USD had been weak. The general sense was that Bernanke would come out with a policy that would push down the value of the currency as he has done before. As the statement was released, the initial reaction was a further drop of the USD and stock prices popped higher. But, we saw immediately that this was the wrong reading of the details. In particular, the Twist Program was less than anticipated and would be done over a longer period of time. In other words, the “shock and awe” was not there. The plan is not big enough and the planned buying was further out on the curve than anticipated at a slower pace than markets expected.
Already bank stocks had been under pressure due to the Moody’s downgrade of Bank of America (BAC), Wells Fargo (WFC) and Citiroup (C). The additional pressure of the unexpected level that the yield curve would be flattened was going to crimp bank’s earnings power. By the end of the day, the Financial Sector was down by 5%, the worst performing of the S&P 500 Sectors. (Note: We bought a Put Option on the SPDR Financial ETF (XLF) yesterday for protection into the FED statement. The position provided an unrealized profit of 83% at the close on Wednesday, helping to keep portfolio losses to under 0.25% for the day.)
Read a side-by-side comparison of the FEDS’s last two statements —-> HERE
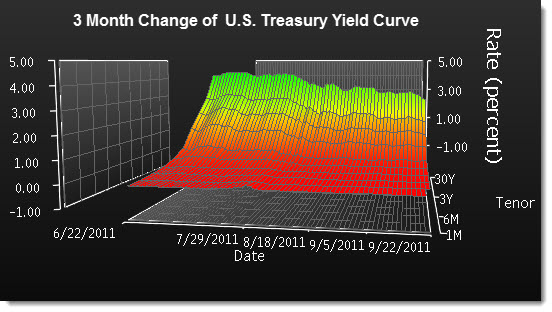
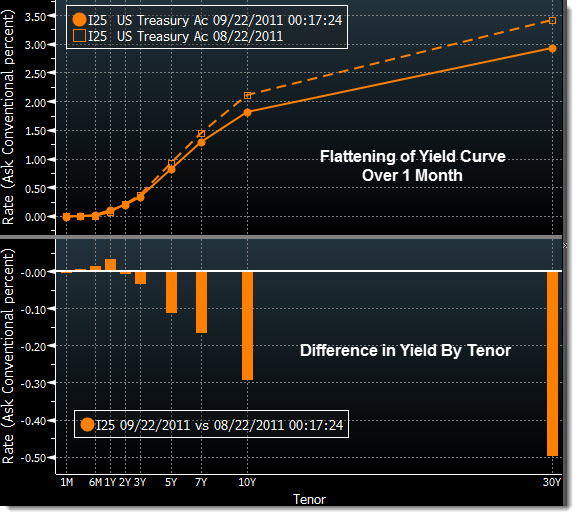
Over the past month or so, the prices of U.S. Treasuries have jumped and rates have been hitting historic lows. Buyers rushed into the 30-year Treasury after the FED’s statement with a vengeance. Below are a series of charts that illustrate the changing dynamic of the yield-curve and puts into perspective the power of the FED.
The equity markets did not take too well to the change in the outlook by the FED or the rush to buy Treasuries. The addition of the word “significant” in front of downside risk (relating to the outlook for the economy) showed that the FED is seeing a difficult road ahead. It is not often that negative sentiment is transmitted by FED officials and this was an official release none-the-less!
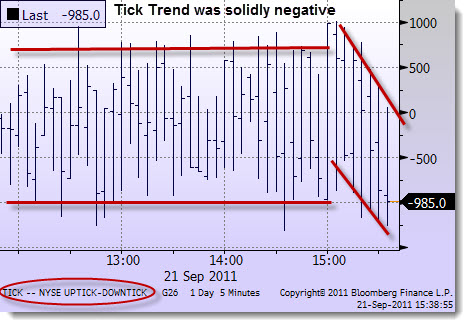
That fueled the selling of stocks and further ignited the buying of bonds. Below is the “tick” readings throughout the day for the NYSE. Essentially it is the buy/sell ticks on a 5-minute basis. Notice that at 3pm the market came to a major turning point when sellers overwhelmed any buyers. The intense selling dropped markets sharply and the result was an initial confirmation of a bear flag pattern in the S&P 500. (To be explored in the next update)
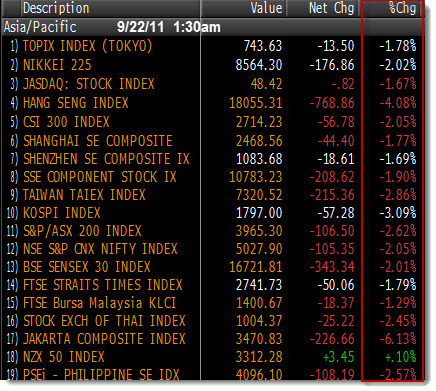
Asia markets were not at all happy that Bernanke said the U.S. economy is slowing. Equity markets sold off hard with Hong Kong down over 4% during the mid-day session.
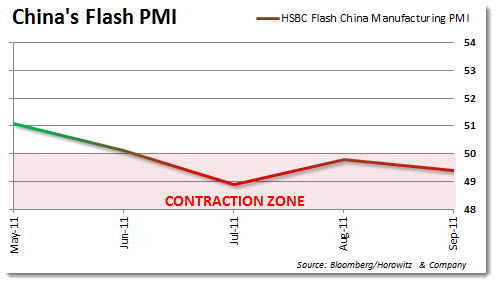
The sell-off was already underway when China’s Flash PMI report was released for September. The level came in at 49.4, showing a drop of 0.5 from the prior month. Most were expecting to see a reading higher than 50.
An index above 50 means the number of manufacturers who said conditions improved was greater than the number saying they deteriorated. The flash figure is based on 85 percent to 90 percent of the total responses to its monthly purchasing managers‘ survey to be announced at the beginning of next month.
Our outlook remains cautious as the downshift in global economic activity is gaining strength. Add that to the worsening situation in Europe and we will continue to hold a high level of cash, hedge portfolio positions and stop-out of securities when they break down past our predetermined levels. As of the close on Wednesday, our Market Trend Indicator has ratcheted back a notch and unless there is some major change, we expect to drop long exposure down even further. Also, when our indicators are at this level, shorter trading may be used as opportunities arise – especially with high volatility.
Latest Podcast Episode: TDI Podcast: Shorting Europe, The Mystery Broker, Market Rally Almost Done (#230)
Guest(s): Mike Santoli, Barron’s
___
___
Looking to invest in The Disciplined Investor Managed Growth Strategy?
Click HERE for the virtual tour….
___


