Bloomberg Professional has a few very interesting built-in charting features. Two that can help to quickly discern the direction and sentiment are the Fear/Greed Indicator and the Trender.
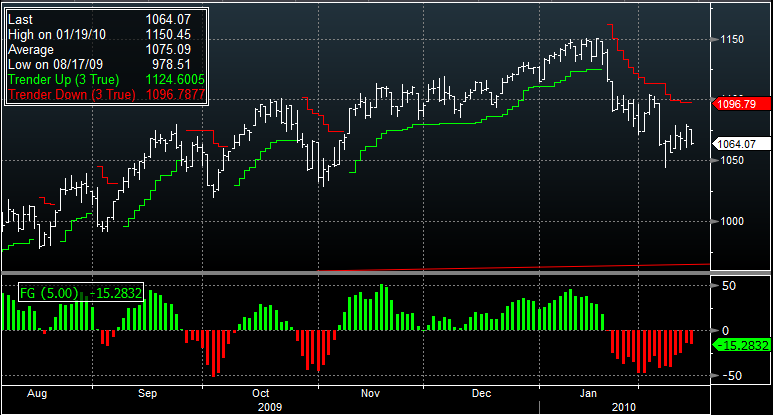
The top portion of the chart shows the Bloomberg Trender and the RED indicates that the direction is obviously down. Overhead resistance at 1096.79 is where the S&P 500 index will need to move through in order to change that to a GREEN line, indicating that a new move higher may be occurring at that time.
For a quickly moving, sideways market it may not be the best way to judge direction, but it has done a solid job of predicting and tracking longer-term moves. There are several additional lines that can be drawn, each with differing standard deviations from the core Trender. Each serves to show a longer or shorter time frame for entry or exit.
The lower portion of the chart is Bloomberg’s Fear/Greed Indicator. It provides a similar trend view, but has a proprietary set of inputs that they use to calculate whether the herd is moving and/or changing direction. We like to view the histogram as a simple oscillator result to provide additional confirmation for entry or exit points.
In other words, when the F/G indicators crosses the zero line by 5 points it can signal a change in direction.
(Click Chart to Enlarge)
___
Looking to invest in The Disciplined Investor Managed Growth Strategy?
Click below for the 14-minute virtual tour….
Disclosure: Horowitz & Company clients may hold positions of securities mentioned as of the date published.


